

Raydium drops nearly 10% after weak technical indicators and broader market decline

Raydium (RAY) slid 9.85% as persistent selling pressure in the broader crypto market outweighed recent positive protocol activity. The negative move is supported by RAY trading below its 20-day and 50-day moving averages, with continued weakness across multiple technical indicators.
 1.3994
1.8135
Highlights
- Raydium recorded a sharp rise in Q3 2026 operations, with pool fees tripling and trading volume doubling compared to the prior period.
- The protocol conducted $5.23 million in RAY token repurchases, bringing its buyback wallet to 32.6% of circulating supply as of October 28.
- RAY/USD remains under sustained seller pressure below key moving averages, with a projected 5-day range of $1.1473 to $1.5169 and a 77% probability of further downside.
Operational growth and buybacks fail to offset market-driven pressure
Raydium reported significant operational growth in Q3 2026, with pool fees tripling as trading volume doubled and a larger share of swap fees supporting increased RAY token buybacks. The protocol repurchased $5.23 million in RAY during the quarter, with its buyback wallet now holding 32.6% of circulating supply as of October 28. These updates occurred without any confirmed protocol incidents, security issues, or regulatory actions directly linked to the token, though price action has remained under broader selling pressure.
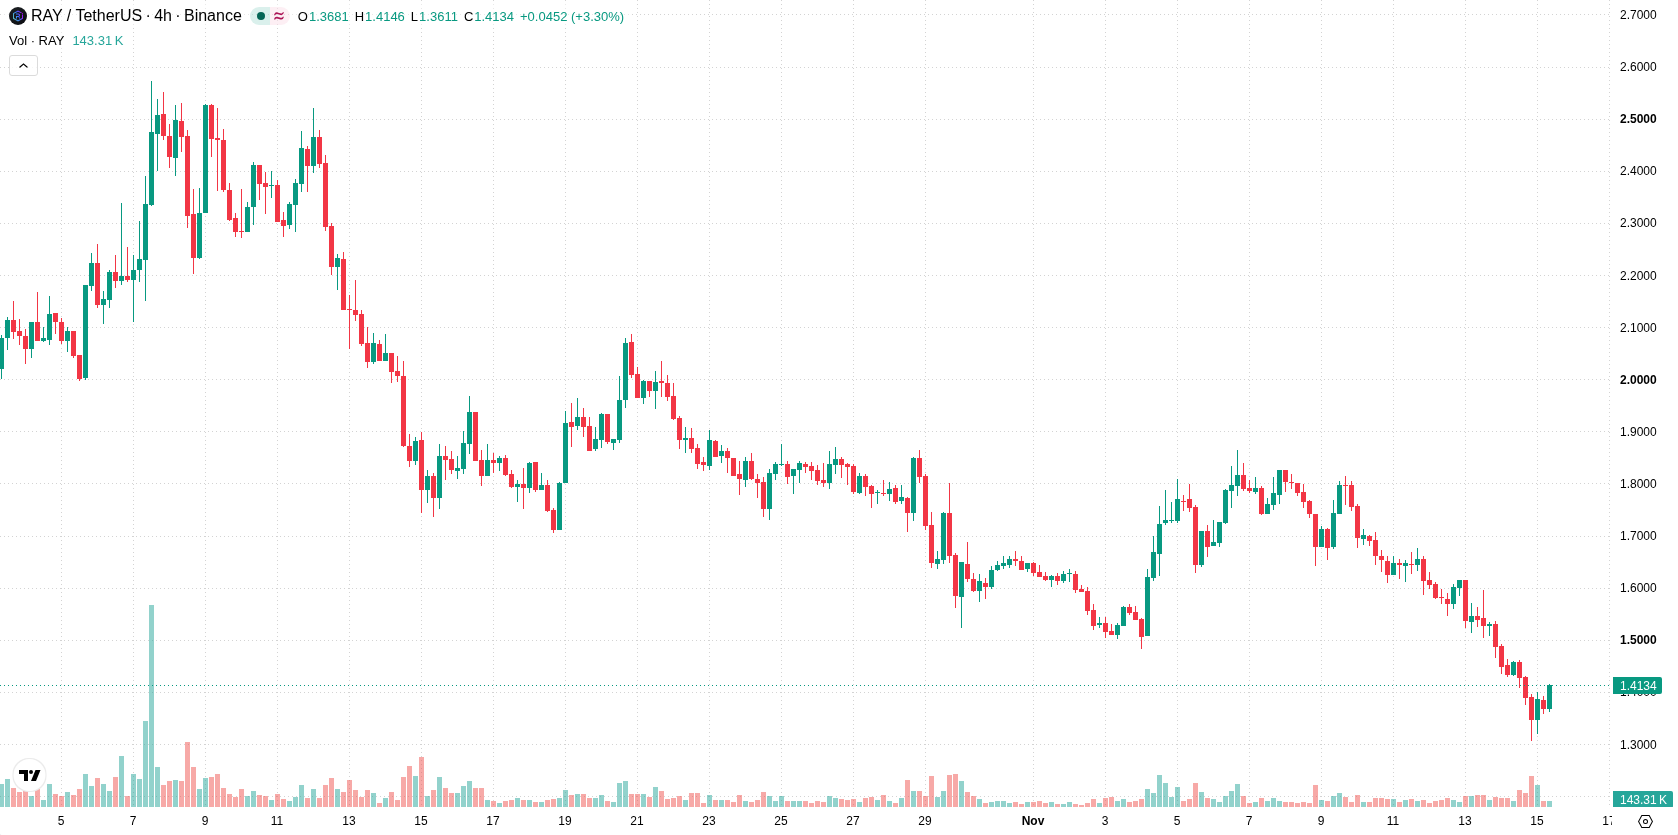
Sustained downside momentum as technical support holds above longer-term floor
RAY/USD trades below its 20-day and 50-day moving averages at $1.6838 and $1.8935, indicating ongoing short- and medium-term pressure from sellers. However, it remains above the 200-day moving average at $1.0739, which suggests longer-term support is still intact. The price is pinned near the session’s low, with the near-term ceiling at $1.3589 and the near-term floor at $1.1473. The Ichimoku Kijun at $1.7844 and other distant resistance levels remain far overhead, further confirming the prevailing bearish structure. Momentum indicators reinforce the negative tone, with the MACD signaling sell and the Average Directional Index (ADX) at 17.5471 indicating a weak trend. The Relative Strength Index (RSI) and Stochastic RSI are neutral, while the Commodity Channel Index (CCI) is in the oversold zone, suggesting potential selling exhaustion but no confirmed rebound. Bull/Bear Power (BBP) at -0.0505 points to sellers dominating intraday momentum, and the Awesome Oscillator continues to read bearish. Intraday volatility stands at 9.83%, and price action reflects heavy selling pressure with little sign of recovery so far.
Earlier, analysts noted that Raydium was under sustained bearish momentum with limited prospects for a near-term reversal. The latest data confirming persistent technical weakness, despite operational improvements, reinforces the prevailing downside risk, with traders advised to monitor the $1.1473 support for signs of accelerated selling.










-
 Afghanistan
-
 Albania
-
 Algeria
-
 Angola
-
 Argentina
-
 Armenia
-
 Australia
-
 Austria
-
 Azerbaijan
-
 Bahamas
-
 Bahrain
-
 Bangladesh
-
 Belarus
-
 Belgium
-
 Bolivia
-
 Botswana
-
 Brazil
-
 Brunei
-
 Bulgaria
-
 Cambodia
-
 Cameroon
-
 Canada
-
 Chile
-
 China
-
 Colombia
-
 Congo
-
 Costa Rica
-
 Cote d'Ivoire
-
 Croatia
-
 Cuba
-
 Cyprus
-
 Czechia
-
 DR Congo
-
 Denmark
-
 Dominican Republic
-
 Ecuador
-
 Egypt
-
 El Salvador
-
 Estonia
-
 Eswatini
-
 Ethiopia
-
 Finland
-
 France
-
 Georgia
-
 Germany
-
 Ghana
-
 Greece
-
 Haiti
-
 Hong Kong
-
 Hungary
-
 India
-
 Indonesia
-
 Iran, Islamic republic
-
 Iraq
-
 Ireland
-
 Israel
-
 Italy
-
 Jamaica
-
 Japan
-
 Jordan
-
 Kazakhstan
-
 Kenya
-
 Korea
-
 Kuwait
-
 Kyrgyzstan
-
 Laos
-
 Latvia
-
 Lebanon
-
 Lesotho
-
 Libya
-
 Lithuania
-
 Luxembourg
-
 Madagascar
-
 Malaysia
-
 Malta
-
 Mauritius
-
 Mexico
-
 Moldova
-
 Mongolia
-
 Montenegro
-
 Morocco
-
 Mozambique
-
 Myanmar
-
 Namibia
-
 Nepal
-
 Netherlands
-
 New Zealand
-
 Nigeria
-
 North Macedonia
-
 Norway
-
 Oman
-
 Pakistan
-
 Palestine
-
 Panama
-
 Papua New Guinea
-
 Paraguay
-
 Peru
-
 Philippines
-
 Poland
-
 Portugal
-
 Puerto Rico
-
 Qatar
-
 Reunion
-
 Romania
-
 Rwanda
-
 Saudi Arabia
-
 Serbia
-
 Singapore
-
 Slovakia
-
 Slovenia
-
 Somalia
-
 South Africa
-
 Spain
-
 Sri Lanka
-
 Sweden
-
 Switzerland
-
 Syria
-
 Taiwan
-
 Tajikistan
-
 Tanzania
-
 Thailand
-
 Trinidad and Tobago
-
 Tunisia
-
 Turkey
-
 UAE
-
 Uganda
-
 Ukraine
-
 United Kingdom
-
United States
-
 Uruguay
-
 Uzbekistan
-
 Venezuela
-
 Vietnam
-
 Yemen
-
 Zambia
-
 Zimbabwe
- Forex
- Crypto












