

Movement slips below $0.0078 support as sellers control the short-term trend

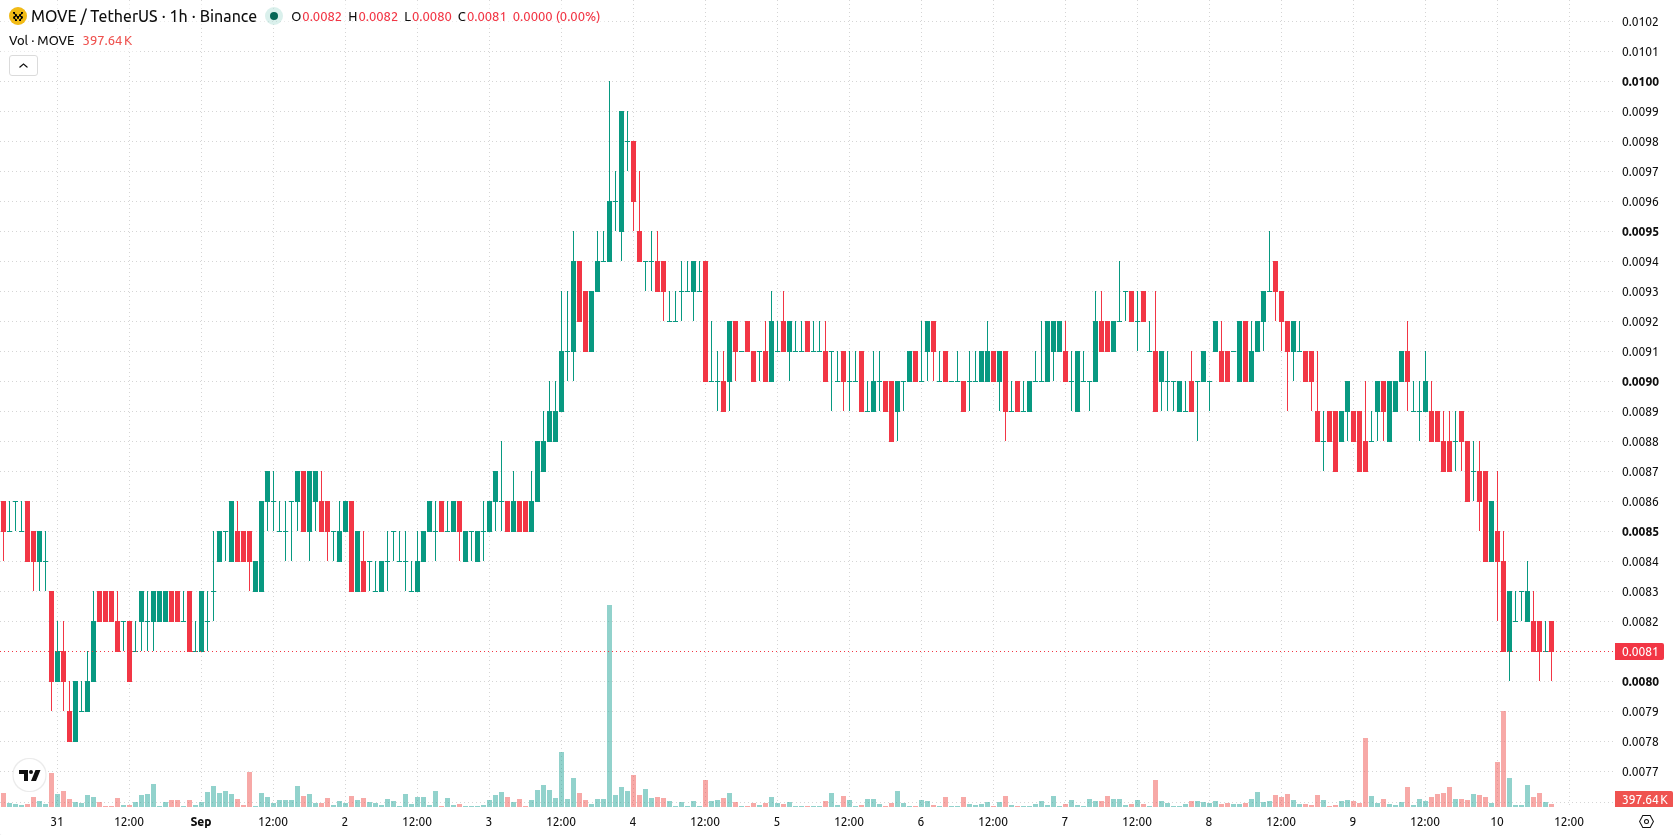
Movement (MOVE) is trading at $0.0081, down 10% on the day. The asset sits below its key moving averages following today’s sharp sell-off.
 0.0049
0.005562
Highlights
- MOVE/USD remains under strong selling pressure, trading below all key moving averages and failing to reclaim short-term resistance.
- Bearish momentum is confirmed by aligned sell signals from MACD, ADX, and RSI, with indicators showing oversold conditions and weak buyer presence.
- Price is expected to consolidate in a $0.0078 to $0.0085 range over the next 2 to 3 days, with a high likelihood of further downside if $0.0078 support fails.
Downside momentum persists as multiple indicators flash sell bias
MOVE/USD is trading below the MA-20 ($0.0085), MA-50 ($0.0088), and the long-term MA-200 ($0.0143). The Ichimoku Kijun is positioned at $0.0086 and is acting as immediate resistance. Both MACD and ADX show a sell bias, while RSI stands at 35.33, indicating sustained downside pressure. CCI signals oversold conditions, Stochastic RSI remains neutral, and Bull/Bear Power confirms seller dominance intraday. Awesome Oscillator is neutral and does not reinforce the prevailing trend.
Downside risk intensifies amid volatility and fragile support
In the short term, the expected trading range over the next 2 to 3 days is $0.0078 to $0.0085, with much greater likelihood of further downside than recovery. The main scenario sees continued consolidation within this corridor. Should MOVE break above $0.0086 and sustain levels over $0.0085, a bullish reversal could take shape. However, if support at $0.0078 fails, another leg lower becomes the key risk within MOVE’s current volatility band.
In a recent review, analysts highlighted that Movement (MOVE) was exhibiting bullish momentum while cautioning that mixed signals and volatility could pose near-term risks. The current article marks a notable shift as downside pressure now prevails, and traders should watch for either a sustained break below $0.0078 signaling further losses, or a move back above $0.0086 as an early sign of potential recovery.










-
 Afghanistan
-
 Albania
-
 Algeria
-
 Angola
-
 Argentina
-
 Armenia
-
 Australia
-
 Austria
-
 Azerbaijan
-
 Bahamas
-
 Bahrain
-
 Bangladesh
-
 Belarus
-
 Belgium
-
 Bolivia
-
 Botswana
-
 Brazil
-
 Brunei
-
 Bulgaria
-
 Cambodia
-
 Cameroon
-
 Canada
-
 Chile
-
 China
-
 Colombia
-
 Congo
-
 Costa Rica
-
 Cote d'Ivoire
-
 Croatia
-
 Cuba
-
 Cyprus
-
 Czechia
-
 DR Congo
-
 Denmark
-
 Dominican Republic
-
 Ecuador
-
 Egypt
-
 El Salvador
-
 Estonia
-
 Eswatini
-
 Ethiopia
-
 Finland
-
 France
-
 Georgia
-
 Germany
-
 Ghana
-
 Greece
-
 Haiti
-
 Hong Kong
-
 Hungary
-
 India
-
 Indonesia
-
 Iran, Islamic republic
-
 Iraq
-
 Ireland
-
 Israel
-
 Italy
-
 Jamaica
-
 Japan
-
 Jordan
-
 Kazakhstan
-
 Kenya
-
 Korea
-
 Kuwait
-
 Kyrgyzstan
-
 Laos
-
 Latvia
-
 Lebanon
-
 Lesotho
-
 Libya
-
 Lithuania
-
 Luxembourg
-
 Madagascar
-
 Malaysia
-
 Malta
-
 Mauritius
-
 Mexico
-
 Moldova
-
 Mongolia
-
 Montenegro
-
 Morocco
-
 Mozambique
-
 Myanmar
-
 Namibia
-
 Nepal
-
 Netherlands
-
 New Zealand
-
 Nigeria
-
 North Macedonia
-
 Norway
-
 Oman
-
 Pakistan
-
 Palestine
-
 Panama
-
 Papua New Guinea
-
 Paraguay
-
 Peru
-
 Philippines
-
 Poland
-
 Portugal
-
 Puerto Rico
-
 Qatar
-
 Reunion
-
 Romania
-
 Rwanda
-
 Saudi Arabia
-
 Serbia
-
 Singapore
-
 Slovakia
-
 Slovenia
-
 Somalia
-
 South Africa
-
 Spain
-
 Sri Lanka
-
 Sweden
-
 Switzerland
-
 Syria
-
 Taiwan
-
 Tajikistan
-
 Tanzania
-
 Thailand
-
 Trinidad and Tobago
-
 Tunisia
-
 Turkey
-
 UAE
-
 Uganda
-
 Ukraine
-
 United Kingdom
-
United States
-
 Uruguay
-
 Uzbekistan
-
 Venezuela
-
 Vietnam
-
 Yemen
-
 Zambia
-
 Zimbabwe
- Forex
- Crypto












