

Bitcoin price prediction: $70,061 support in focus? BTC trades flat

Bitcoin (BTC) is trading at $77,216 with a modest decline for the session and remains below its key short-term moving averages, reflecting near-term softness.
 65200
74811.45
Highlights
- Institutional investors withdrew 2,148 BTC worth $165 million from spot ETFs on September 10, with further $120 million outflows reported, reducing market liquidity.
- Iran’s central bank has eased rules to permit domestic companies to use Bitcoin and Tether for international trade, expanding regulatory use but with little immediate global effect.
- BTC/USD faces weak momentum and trades below key moving averages, with a 72% probability of moving down toward a $75,202 to $79,229 range in coming sessions.
Institutional outflows and Iranian crypto rule change shape liquidity outlook
Bitcoin experienced notable institutional outflows from spot ETFs, with Interactivecrypto reporting that 2,148 BTC, valued at about $165 million, exited these products on September 10. Research Icrypex indicated an additional $120 million in ETF outflows on Wednesday, reflecting continued withdrawal of institutional capital and tightening market liquidity. Separately, Bitcoinethereumnews reported that the Central Bank of Iran has relaxed foreign exchange regulations as of September 11 to enable domestic businesses to employ Bitcoin and Tether for international trade, representing a significant step for regulatory use cases but with limited immediate global effect.
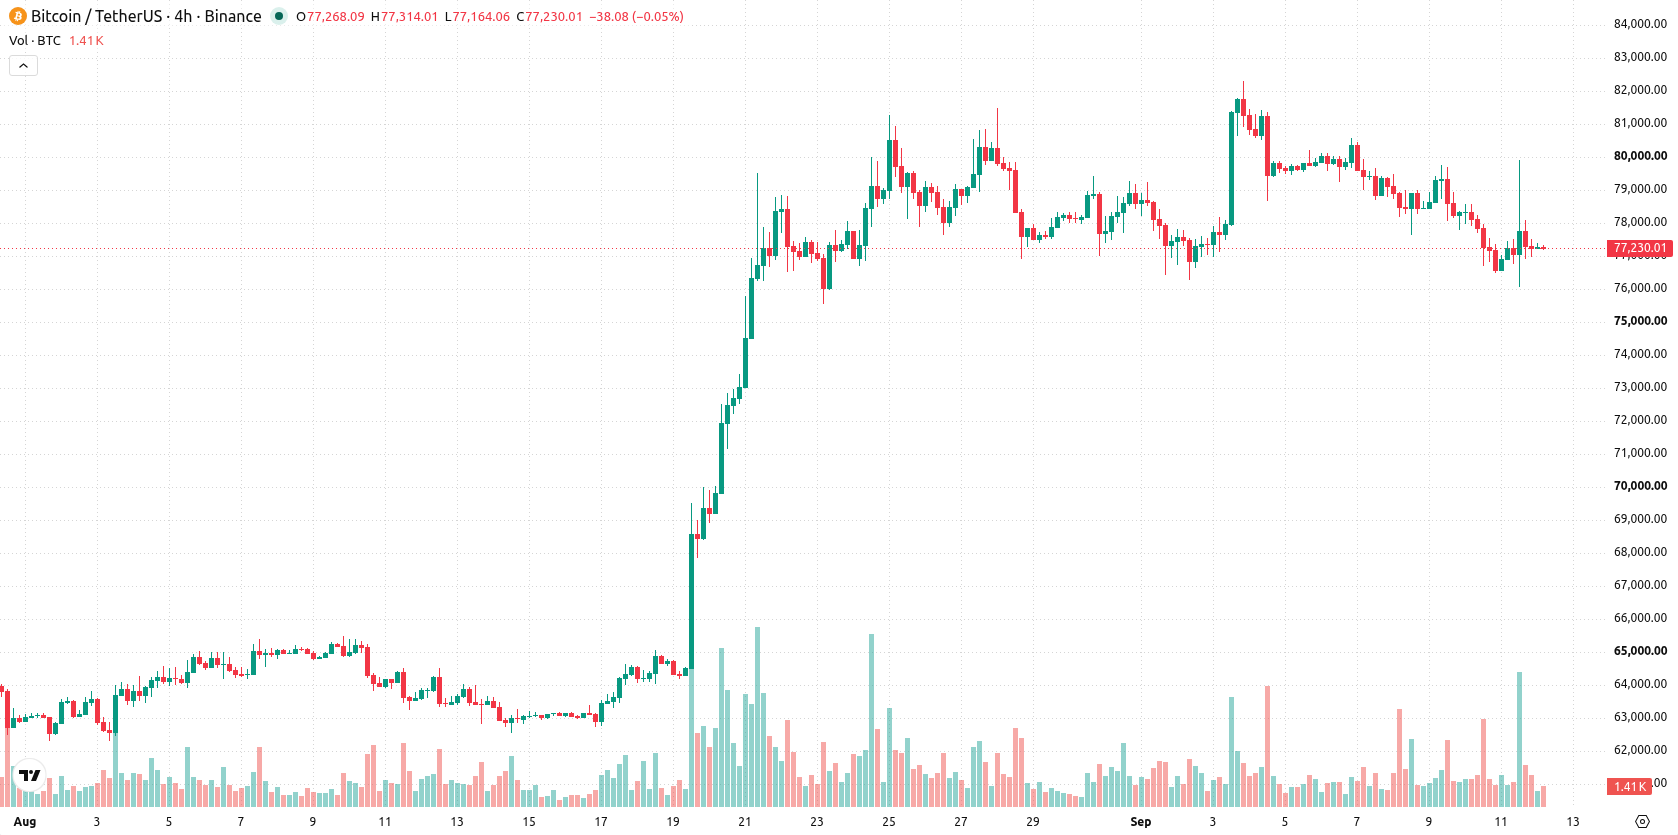
Momentum declines as sellers dominate below technical resistance levels
On the technical side, BTC/USD remains below the MA-20 at $77,838 and MA-50 at $78,929 on the 4-hour chart, while holding above the daily MA-200 at $70,061. The Ichimoku Kijun is positioned at $77,968 as immediate resistance. Indicators show weak momentum: MACD presents a strong sell signal, ADX is classified as Neutral, and RSI at 41.43 along with CCI indicate modest selling pressure. Stoch RSI and the Awesome Oscillator both read Neutral, while Bull/Bear Power signals that sellers are in control, with subdued volatility confirming the current intraday tone.
Consolidation likely as downside risk outweighs potential breakout
In the short term, BTC/USD is anticipated to consolidate within the $75,202 to $79,229 range based on recent volatility bands. There is a 72% probability assigned to further downside movement, while the chance of an upward breakout is assessed at 28%. The baseline expectation is for price action to remain in a sideways channel barring a break above immediate resistance. A move below support could open up a deeper retracement scenario, whereas a bullish shift would require renewed momentum and a clear push through the overhead resistance zone.
Earlier, analysts noted that Bitcoin was under pressure from significant institutional outflows and technical weakness, raising downside risk. The current market environment further underscores this cautious outlook, with continued ETF redemptions and weak momentum indicators pointing to a prevailing scenario of range-bound trading and elevated vulnerability below key support levels.











-
 Afghanistan
-
 Albania
-
 Algeria
-
 Angola
-
 Argentina
-
 Armenia
-
 Australia
-
 Austria
-
 Azerbaijan
-
 Bahamas
-
 Bahrain
-
 Bangladesh
-
 Belarus
-
 Belgium
-
 Bolivia
-
 Botswana
-
 Brazil
-
 Brunei
-
 Bulgaria
-
 Cambodia
-
 Cameroon
-
 Canada
-
 Chile
-
 China
-
 Colombia
-
 Congo
-
 Costa Rica
-
 Cote d'Ivoire
-
 Croatia
-
 Cuba
-
 Cyprus
-
 Czechia
-
 DR Congo
-
 Denmark
-
 Dominican Republic
-
 Ecuador
-
 Egypt
-
 El Salvador
-
 Estonia
-
 Eswatini
-
 Ethiopia
-
 Finland
-
 France
-
 Georgia
-
 Germany
-
 Ghana
-
 Greece
-
 Haiti
-
 Hong Kong
-
 Hungary
-
 India
-
 Indonesia
-
 Iran, Islamic republic
-
 Iraq
-
 Ireland
-
 Israel
-
 Italy
-
 Jamaica
-
 Japan
-
 Jordan
-
 Kazakhstan
-
 Kenya
-
 Korea
-
 Kuwait
-
 Kyrgyzstan
-
 Laos
-
 Latvia
-
 Lebanon
-
 Lesotho
-
 Libya
-
 Lithuania
-
 Luxembourg
-
 Madagascar
-
 Malaysia
-
 Malta
-
 Mauritius
-
 Mexico
-
 Moldova
-
 Mongolia
-
 Montenegro
-
 Morocco
-
 Mozambique
-
 Myanmar
-
 Namibia
-
 Nepal
-
 Netherlands
-
 New Zealand
-
 Nigeria
-
 North Macedonia
-
 Norway
-
 Oman
-
 Pakistan
-
 Palestine
-
 Panama
-
 Papua New Guinea
-
 Paraguay
-
 Peru
-
 Philippines
-
 Poland
-
 Portugal
-
 Puerto Rico
-
 Qatar
-
 Reunion
-
 Romania
-
 Rwanda
-
 Saudi Arabia
-
 Serbia
-
 Singapore
-
 Slovakia
-
 Slovenia
-
 Somalia
-
 South Africa
-
 Spain
-
 Sri Lanka
-
 Sweden
-
 Switzerland
-
 Syria
-
 Taiwan
-
 Tajikistan
-
 Tanzania
-
 Thailand
-
 Trinidad and Tobago
-
 Tunisia
-
 Turkey
-
 UAE
-
 Uganda
-
 Ukraine
-
 United Kingdom
-
United States
-
 Uruguay
-
 Uzbekistan
-
 Venezuela
-
 Vietnam
-
 Yemen
-
 Zambia
-
 Zimbabwe
- Forex
- Crypto












