

Dash extends recovery but faces overbought risk: weekly outlook

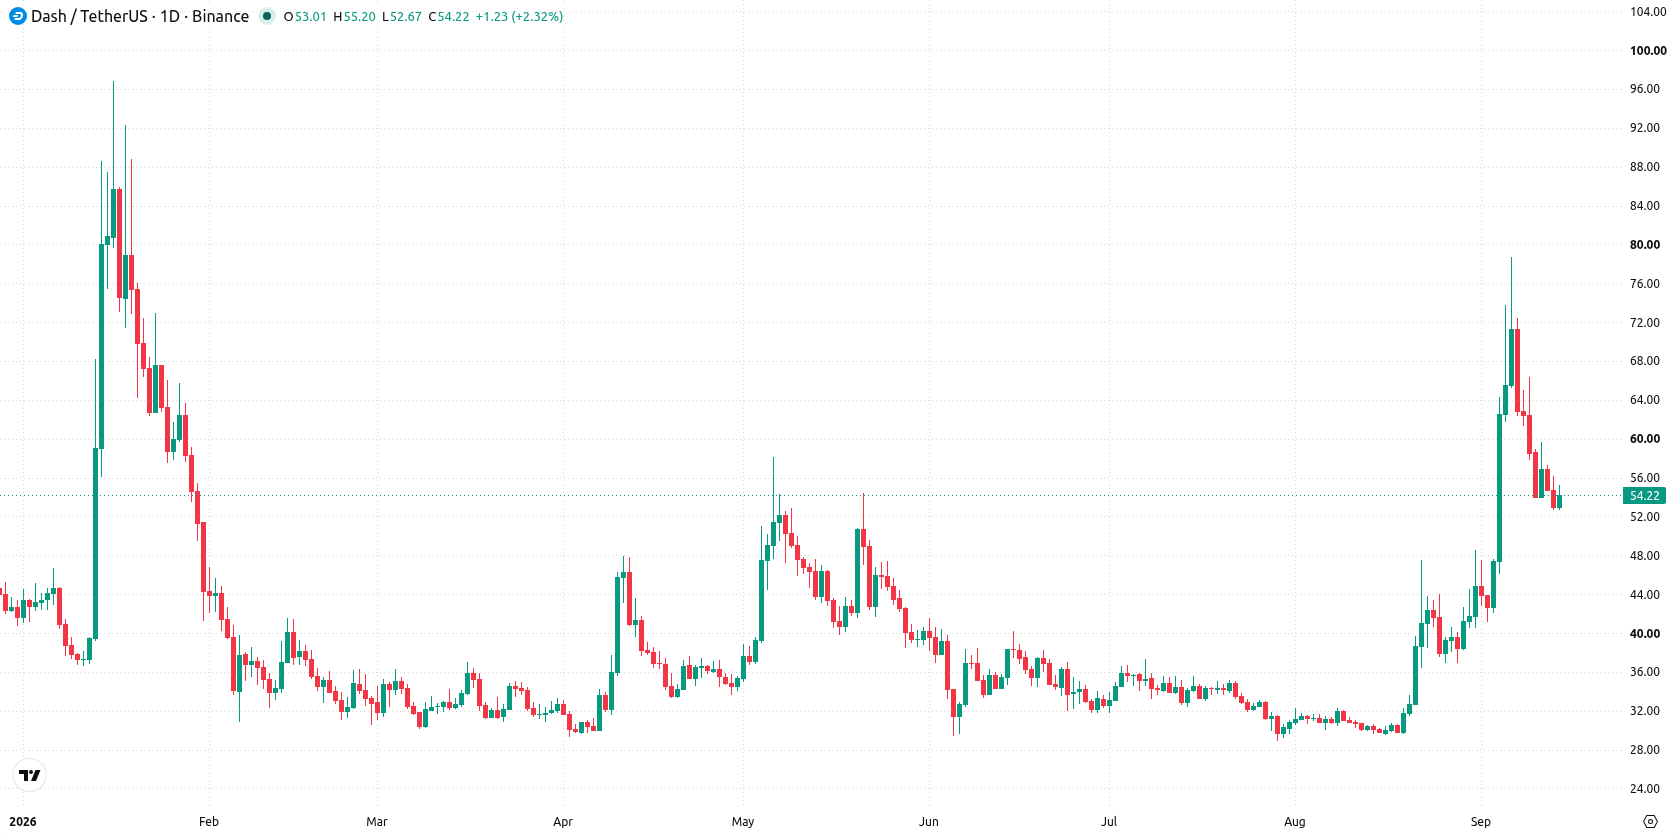
Dash (DASH) is trading near $54 after a sharp move lower of almost 20% this week, as flows into privacy coins cooled following recent ETF-driven momentum. The token's performance continues to be closely linked to shifts in institutional demand and sector-specific news. Heading into the week, attention turns to whether renewed ecosystem activity can help DASH stabilize after recent volatility.
 171.13
179.59
Highlights
- Dash price fell 19.76% in the past week to $54.07, closing near the bottom of its recent trading range.
- The trend remains technically bullish long term, but price is pinned between a key support at $52.62 and resistance at $54.15.
- For the coming week, Dash is forecast to trade between $46.77 and $64.88 with a 76% probability of an increase.
Adoption momentum builds as ETF launch and network upgrade drive optimism
Dash rallied in late August and early September 2026 as the launch of the Grayscale spot Zcash ETF spurred institutional flows into privacy-focused coins. According to Coinsprobe, additional sector optimism was generated by DashCon 2026, its first major event since 2019, and a key network upgrade with the mainnet launch of Dash Platform v1.1 on September 4, as reported by The Merkle. These developments introduced features like decentralized data storage and on-chain usernames, expanding Dash's ecosystem. Market sentiment now focuses on whether Dash can maintain elevated adoption levels following this surge in activity.
Conflicting signals emerge as MACD strength meets oversold Stochastic RSI
The daily chart outlines a sustained move lower with a firm trend, underscored by high volatility at 26.19%. While the Stochastic RSI is in the oversold zone, the MACD is notably bullish with a reading of 6.43, highlighting conflicting signals between momentum exhaustion and underlying trend strength. The nearest support sits at $52.62, with price pinned to resistance at the Ichimoku Kijun at $54.15. This positioning suggests a pivotal area where short-term direction may be decided in the coming sessions.
Bullish bias holds if $54 breakout sustains as weekly range tightens
Next week, DASH/USD is expected to trade between $46.77 and $64.88. There is a 76% probability of an increase and a 24% probability of a decrease. The base case sees price ranging between support at $52.62 and resistance at $54.15, with consolidation or swings within these bands. A move above $54.15 would open up the upper end of the range, while a drop below $52.62 would likely accelerate declines toward $46.77.
Earlier, analysts noted that Dash was experiencing persistent selling pressure, reinforcing a bearish near-term outlook. The current setup introduces a possible inflection point driven by new ecosystem activity, with the $54.15 resistance serving as a critical level that could determine the next directional move.










-
 Afghanistan
-
 Albania
-
 Algeria
-
 Angola
-
 Argentina
-
 Armenia
-
 Australia
-
 Austria
-
 Azerbaijan
-
 Bahamas
-
 Bahrain
-
 Bangladesh
-
 Belarus
-
 Belgium
-
 Bolivia
-
 Botswana
-
 Brazil
-
 Brunei
-
 Bulgaria
-
 Cambodia
-
 Cameroon
-
 Canada
-
 Chile
-
 China
-
 Colombia
-
 Congo
-
 Costa Rica
-
 Cote d'Ivoire
-
 Croatia
-
 Cuba
-
 Cyprus
-
 Czechia
-
 DR Congo
-
 Denmark
-
 Dominican Republic
-
 Ecuador
-
 Egypt
-
 El Salvador
-
 Estonia
-
 Eswatini
-
 Ethiopia
-
 Finland
-
 France
-
 Georgia
-
 Germany
-
 Ghana
-
 Greece
-
 Haiti
-
 Hong Kong
-
 Hungary
-
 India
-
 Indonesia
-
 Iran, Islamic republic
-
 Iraq
-
 Ireland
-
 Israel
-
 Italy
-
 Jamaica
-
 Japan
-
 Jordan
-
 Kazakhstan
-
 Kenya
-
 Korea
-
 Kuwait
-
 Kyrgyzstan
-
 Laos
-
 Latvia
-
 Lebanon
-
 Lesotho
-
 Libya
-
 Lithuania
-
 Luxembourg
-
 Madagascar
-
 Malaysia
-
 Malta
-
 Mauritius
-
 Mexico
-
 Moldova
-
 Mongolia
-
 Montenegro
-
 Morocco
-
 Mozambique
-
 Myanmar
-
 Namibia
-
 Nepal
-
 Netherlands
-
 New Zealand
-
 Nigeria
-
 North Macedonia
-
 Norway
-
 Oman
-
 Pakistan
-
 Palestine
-
 Panama
-
 Papua New Guinea
-
 Paraguay
-
 Peru
-
 Philippines
-
 Poland
-
 Portugal
-
 Puerto Rico
-
 Qatar
-
 Reunion
-
 Romania
-
 Rwanda
-
 Saudi Arabia
-
 Serbia
-
 Singapore
-
 Slovakia
-
 Slovenia
-
 Somalia
-
 South Africa
-
 Spain
-
 Sri Lanka
-
 Sweden
-
 Switzerland
-
 Syria
-
 Taiwan
-
 Tajikistan
-
 Tanzania
-
 Thailand
-
 Trinidad and Tobago
-
 Tunisia
-
 Turkey
-
 UAE
-
 Uganda
-
 Ukraine
-
 United Kingdom
-
United States
-
 Uruguay
-
 Uzbekistan
-
 Venezuela
-
 Vietnam
-
 Yemen
-
 Zambia
-
 Zimbabwe
- Forex
- Crypto












