


Chainlink (LINK) fell 7.19% after encountering persistent short-term selling pressure, even as major institutional partnerships continue to advance its adoption as a blockchain oracle provider. The decline is supported by price action slipping below the 20-day moving average and encountering resistance from the Ichimoku Kijun, despite the medium- and long-term bullish structure remaining intact.
 9.36
10.69
Highlights
- Chainlink formed a partnership with Bottomline, connecting off-chain banking infrastructure serving over 600 global banks to multiple blockchains.
- Recent integrations include Robinhood, Coinbase/Base, Aave, Wyoming's stablecoin project, and the U.S. Commerce Department publishing economic data on-chain, with institutional inflows to spot LINK ETF products reaching over $150 million by mid-September.
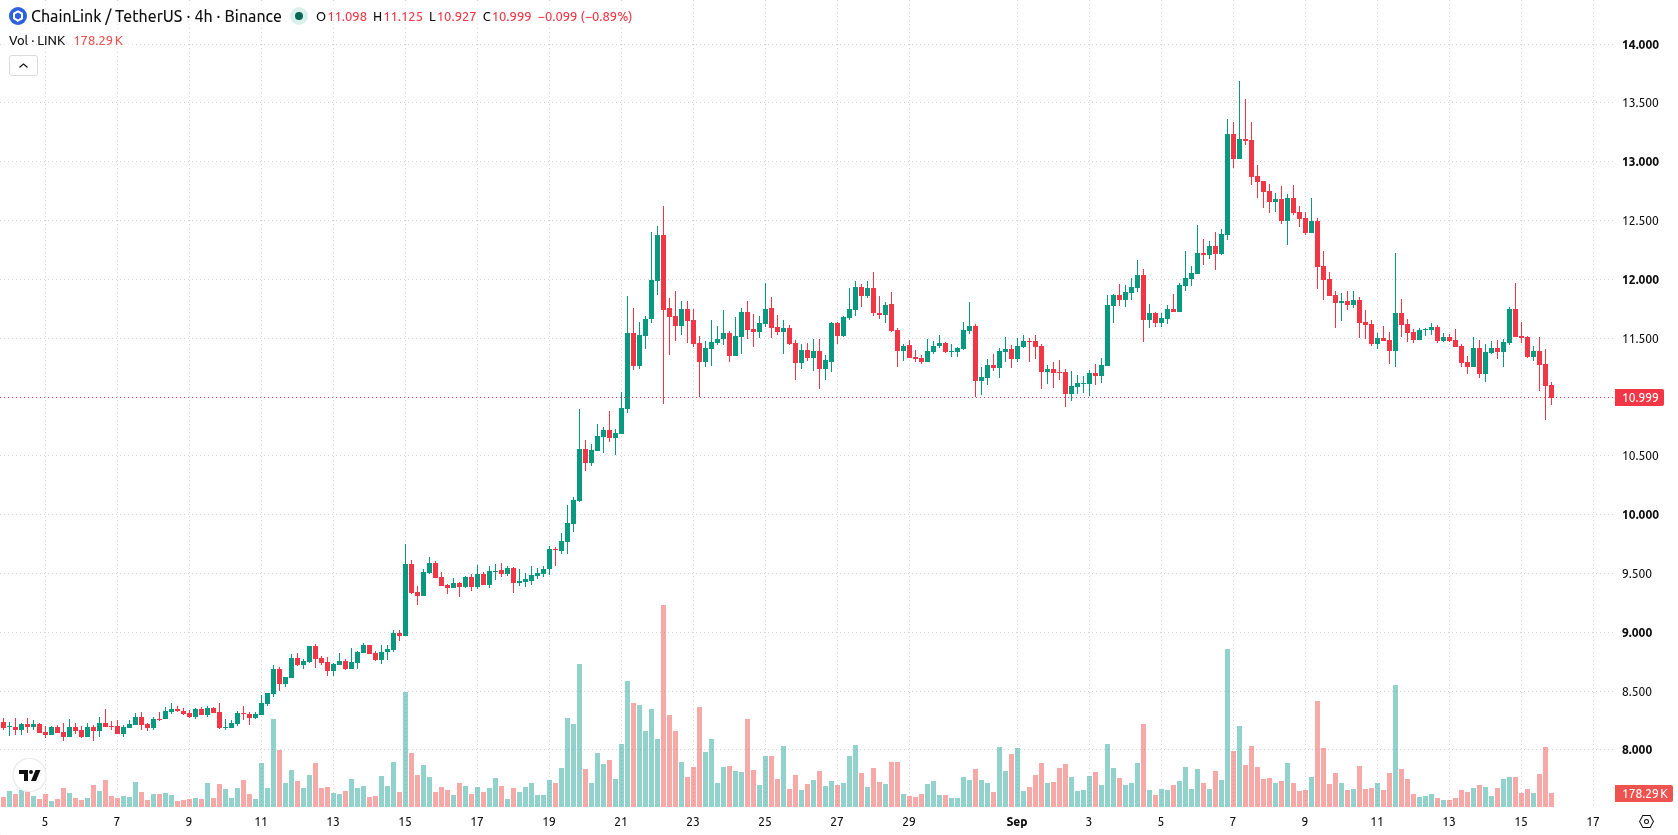
- LINK/USD trades near $10.99, showing short-term selling pressure but maintaining a medium- and long-term bullish structure, with an expected five-day range of $9.7 to $11.78 and a baseline sideways outlook.
Institutional inflows rise as broad selling curbs price gains
Chainlink announced a partnership with Bottomline, a facilitator for over 600 global banks, to connect off-chain banking infrastructure to multiple blockchains. The protocol's Cross-Chain Interoperability Protocol was reported to have gained recent integrations with several major platforms, including Robinhood, Coinbase/Base, Aave, Wyoming's stablecoin initiative, and the U.S. Commerce Department, which now uses Chainlink for publishing economic data on-chain. Institutional involvement was seen in reported net inflows to US spot LINK ETF products, totaling over $150 million by mid-September, alongside news that Chainlink's co-founder will participate in a Federal Reserve Bank of Philadelphia conference on digital asset regulation, tokenization, and institutional adoption, though price action has remained under broader selling pressure.
Mixed buy signals emerge as LINK tests key support levels
LINK/USD is trading below its 20-day moving average at $11.72 but remains above both the 50-day ($10.22) and 200-day ($9.14) moving averages, indicating short-term selling pressure while the medium- and long-term bullish structure holds. The near-term ceiling is at $11.12, with immediate support at the floor of $10.8. Price action is encountering resistance from the Ichimoku Kijun at $12.03, which reinforces the prevailing bullish alignment between the MA-50 and MA-200. Momentum indicators show mixed signals: the MACD and Average Directional Index (ADX) forecast a 'Buy' to 'Strong Buy' stance, while the Relative Strength Index (RSI) reads a moderately neutral 54.35. The Stochastic RSI is at 19.47 and Bull/Bear Power (BBP) is just above zero at 0.05, noting an oversold intraday condition with slight buyer dominance. Commodity Channel Index (CCI) and Awesome Oscillator (AO) are neutral, reflecting divergence among oscillators. LINK is near the session low with high daily volatility at 7.69%, and ongoing momentum suggests selling pressure outweighs new buying interest.
Earlier, analysts noted that Chainlink was highlighted as a key infrastructure beneficiary as regulatory and institutional developments around tokenized finance advanced, regardless of legislative outcomes. With LINK now experiencing elevated volatility amid ongoing institutional adoption and integration milestones, traders should monitor the $10.8 support and $11.12 resistance as pivotal levels for near-term directional confirmation.






Latest Chainlink News




-
 Afghanistan
-
 Albania
-
 Algeria
-
 Angola
-
 Argentina
-
 Armenia
-
 Australia
-
 Austria
-
 Azerbaijan
-
 Bahamas
-
 Bahrain
-
 Bangladesh
-
 Belarus
-
 Belgium
-
 Bolivia
-
 Botswana
-
 Brazil
-
 Brunei
-
 Bulgaria
-
 Cambodia
-
 Cameroon
-
 Canada
-
 Chile
-
 China
-
 Colombia
-
 Congo
-
 Costa Rica
-
 Cote d'Ivoire
-
 Croatia
-
 Cuba
-
 Cyprus
-
 Czechia
-
 DR Congo
-
 Denmark
-
 Dominican Republic
-
 Ecuador
-
 Egypt
-
 El Salvador
-
 Estonia
-
 Eswatini
-
 Ethiopia
-
 Finland
-
 France
-
 Georgia
-
 Germany
-
 Ghana
-
 Greece
-
 Haiti
-
 Hong Kong
-
 Hungary
-
 India
-
 Indonesia
-
 Iran, Islamic republic
-
 Iraq
-
 Ireland
-
 Israel
-
 Italy
-
 Jamaica
-
 Japan
-
 Jordan
-
 Kazakhstan
-
 Kenya
-
 Korea
-
 Kuwait
-
 Kyrgyzstan
-
 Laos
-
 Latvia
-
 Lebanon
-
 Lesotho
-
 Libya
-
 Lithuania
-
 Luxembourg
-
 Madagascar
-
 Malaysia
-
 Malta
-
 Mauritius
-
 Mexico
-
 Moldova
-
 Mongolia
-
 Montenegro
-
 Morocco
-
 Mozambique
-
 Myanmar
-
 Namibia
-
 Nepal
-
 Netherlands
-
 New Zealand
-
 Nigeria
-
 North Macedonia
-
 Norway
-
 Oman
-
 Pakistan
-
 Palestine
-
 Panama
-
 Papua New Guinea
-
 Paraguay
-
 Peru
-
 Philippines
-
 Poland
-
 Portugal
-
 Puerto Rico
-
 Qatar
-
 Reunion
-
 Romania
-
 Rwanda
-
 Saudi Arabia
-
 Serbia
-
 Singapore
-
 Slovakia
-
 Slovenia
-
 Somalia
-
 South Africa
-
 Spain
-
 Sri Lanka
-
 Sweden
-
 Switzerland
-
 Syria
-
 Taiwan
-
 Tajikistan
-
 Tanzania
-
 Thailand
-
 Trinidad and Tobago
-
 Tunisia
-
 Turkey
-
 UAE
-
 Uganda
-
 Ukraine
-
 United Kingdom
-
United States
-
 Uruguay
-
 Uzbekistan
-
 Venezuela
-
 Vietnam
-
 Yemen
-
 Zambia
-
 Zimbabwe
- Forex
- Crypto












