

BNB holds near key support as oversold signals appear on the chart: weekly analysis

Binance Coin (BNB) is trading near $710 after sliding nearly 6% over the past week, as heavy pressure stretched the prevailing downtrend toward key support zones. The chart reveals persistent bearish momentum, with oversold signals and resistance still overhead — setting up the week ahead for a crucial test of whether bears can hold control or mean reversion attempts emerge.
 597.8
692.64
Highlights
- Binance Coin is trading at $709.73, down $45.82 or 6.02% over the past week with a move below its short-term trend indicator.
- The asset is under short-term pressure with oversold momentum readings, but longer-term technical structure remains bullish.
- Expected 7-day range is $689.62 to $805.91, with a consolidation base case between support at $703.62 and resistance at $716.94.
Infrastructure upgrades and DeFi growth underpin sentiment despite price decline
BNB Smart Chain increased its block gas limit to 70 million and outlined plans for further increments based on mainnet performance, aiming to boost transaction capacity and efficiency while minimizing operational risks, according to en.cryptonomist.ch and cryptobriefing.com. Chainflip added BNB to its testnet as of September 9, with a mainnet release scheduled later in September, promoting greater blockchain interoperability, as noted by openpr.com. Meanwhile, tokenized stock usage on BNB Chain reached 3.6 million holders, underscoring BNB's expanding role in decentralized finance, according to coinfomania.com.
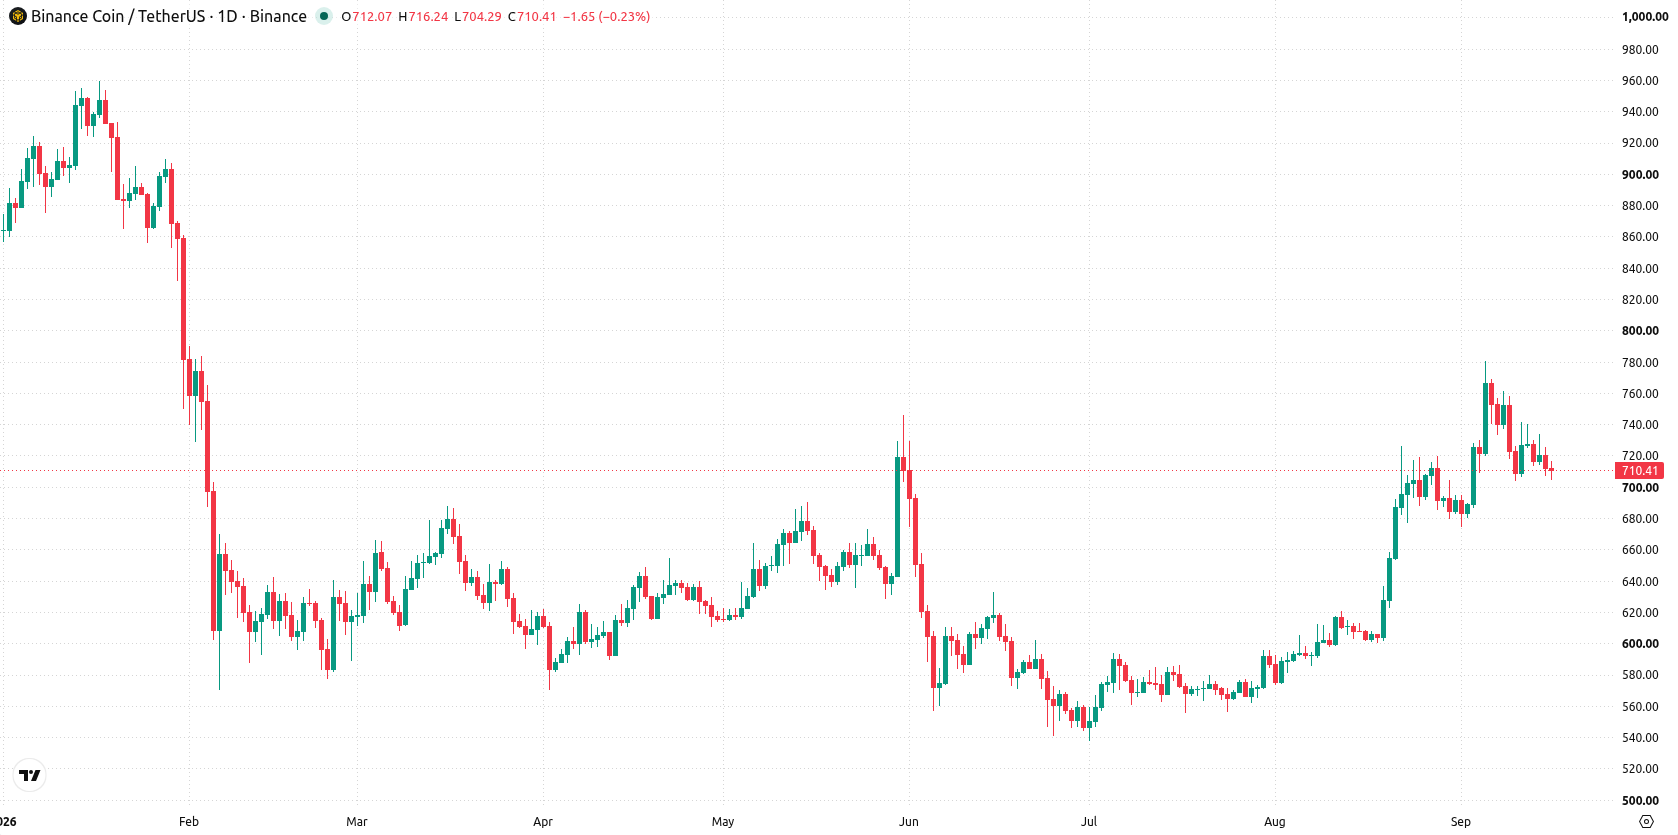
Oversold momentum builds as technicals point to mean reversion risk
On the daily chart, Binance Coin is experiencing a sustained move lower with a firm trend after a volatile week with 5.4% realized volatility. Stochastic RSI is in the oversold zone at 3.17, while trend indicators including MACD and ADX both point toward ongoing underlying strength. Immediate support stands at $703.62, with resistance at the Ichimoku Kijun level of $716.94. This mix of oversold near-term momentum and a firm trend may encourage mean reversion, but bears remain in control unless resistance is reclaimed.
Consolidation favored in coming week pending breakout from support–resistance band
Over the next 7 days, Binance Coin is expected to trade in a $689.62 to $805.91 range. There is a 65% probability of an increase and a 35% probability of a decrease, according to the current signals. The base case is for consolidation between support at $703.62 and resistance at $716.94. A sustained move above resistance would open scope toward the upper end of the projected range, while a break below support could quickly bring the $689.62 level into view.
Previously it was reported that Binance Coin sustained a bullish trend supported by technical strength and ecosystem developments, despite some signs of overbought conditions. The current analysis signals a shift, with bears now holding control and a key test of support at $703.62 that could determine whether downside risk toward $689.62 or mean reversion dominates in the coming sessions.














-
 Afghanistan
-
 Albania
-
 Algeria
-
 Angola
-
 Argentina
-
 Armenia
-
 Australia
-
 Austria
-
 Azerbaijan
-
 Bahamas
-
 Bahrain
-
 Bangladesh
-
 Belarus
-
 Belgium
-
 Bolivia
-
 Botswana
-
 Brazil
-
 Brunei
-
 Bulgaria
-
 Cambodia
-
 Cameroon
-
 Canada
-
 Chile
-
 China
-
 Colombia
-
 Congo
-
 Costa Rica
-
 Cote d'Ivoire
-
 Croatia
-
 Cuba
-
 Cyprus
-
 Czechia
-
 DR Congo
-
 Denmark
-
 Dominican Republic
-
 Ecuador
-
 Egypt
-
 El Salvador
-
 Estonia
-
 Eswatini
-
 Ethiopia
-
 Finland
-
 France
-
 Georgia
-
 Germany
-
 Ghana
-
 Greece
-
 Haiti
-
 Hong Kong
-
 Hungary
-
 India
-
 Indonesia
-
 Iran, Islamic republic
-
 Iraq
-
 Ireland
-
 Israel
-
 Italy
-
 Jamaica
-
 Japan
-
 Jordan
-
 Kazakhstan
-
 Kenya
-
 Korea
-
 Kuwait
-
 Kyrgyzstan
-
 Laos
-
 Latvia
-
 Lebanon
-
 Lesotho
-
 Libya
-
 Lithuania
-
 Luxembourg
-
 Madagascar
-
 Malaysia
-
 Malta
-
 Mauritius
-
 Mexico
-
 Moldova
-
 Mongolia
-
 Montenegro
-
 Morocco
-
 Mozambique
-
 Myanmar
-
 Namibia
-
 Nepal
-
 Netherlands
-
 New Zealand
-
 Nigeria
-
 North Macedonia
-
 Norway
-
 Oman
-
 Pakistan
-
 Palestine
-
 Panama
-
 Papua New Guinea
-
 Paraguay
-
 Peru
-
 Philippines
-
 Poland
-
 Portugal
-
 Puerto Rico
-
 Qatar
-
 Reunion
-
 Romania
-
 Rwanda
-
 Saudi Arabia
-
 Serbia
-
 Singapore
-
 Slovakia
-
 Slovenia
-
 Somalia
-
 South Africa
-
 Spain
-
 Sri Lanka
-
 Sweden
-
 Switzerland
-
 Syria
-
 Taiwan
-
 Tajikistan
-
 Tanzania
-
 Thailand
-
 Trinidad and Tobago
-
 Tunisia
-
 Turkey
-
 UAE
-
 Uganda
-
 Ukraine
-
 United Kingdom
-
United States
-
 Uruguay
-
 Uzbekistan
-
 Venezuela
-
 Vietnam
-
 Yemen
-
 Zambia
-
 Zimbabwe
- Forex
- Crypto












