

PEPE recovery holds but faces overbought momentum near key Ichimoku Kijun support: weekly forecast

Pepe (PEPE) is holding near $0.0000038 after a strong week, climbing around 15% as institutional flows and meme sector liquidity rotation kept attention on the token. The recovery remains in place but faces stretched technicals, setting up a test of key support and the risk that momentum could slow in the week ahead.
 0.0543
30
0.0543
0.054330
Highlights
- Pepe rose 14.68% to $0.0000038 over the past week, ending at the top of its recent trading range.
- The structure is technically bullish above key averages, though momentum indicators show the asset is overbought and trend confirmation is lacking.
- The 7-day expected range is $0.000003577 to $0.00000456, with near-term support at $0.000003755 and high odds of further upside.
Whale outflows and weak sentiment curb upside momentum during meme coin rotation
Over the past week, PEPE saw pressure from whale wallets scaling back holdings, according to openPR.com and CoinEdition, which weighed on sentiment and limited fresh buying interest. Weak capital flows and subdued trader sentiment have challenged PEPE's ability to extend gains, with technical traders closely monitoring key support and resistance zones as meme coin market rotation continues. Despite the quieter backdrop, PEPE retains a benchmark role in the meme sector and draws renewed focus when liquidity revives.
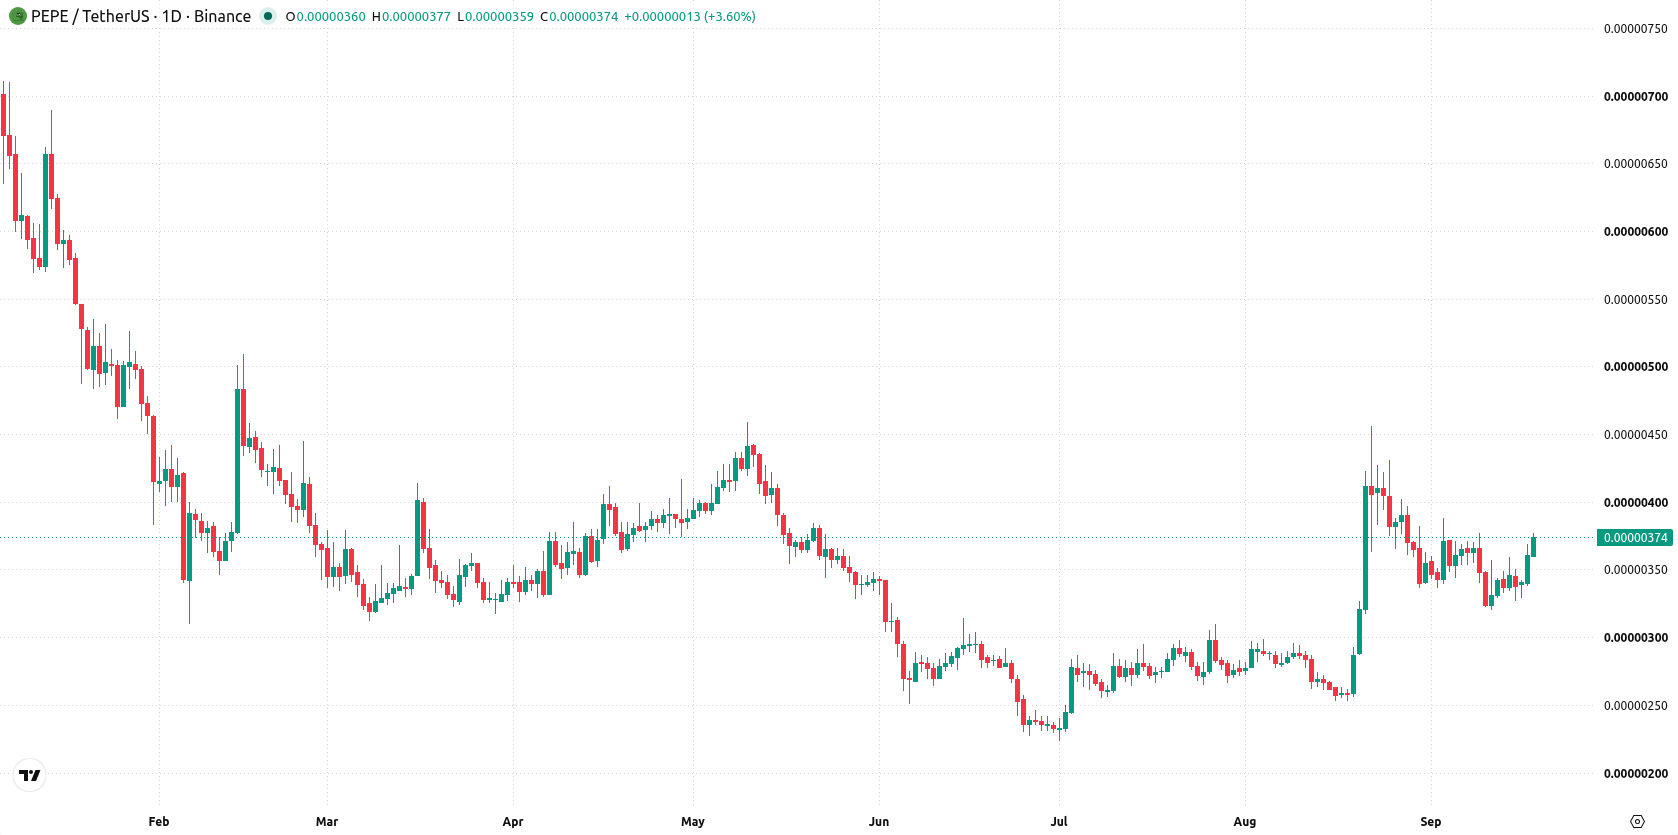
Overbought signals emerge as momentum outpaces trend on elevated volatility
The daily chart shows a move is forming but has yet to confirm a clear trend, with volatility elevated at 12.84%. Momentum reflects a sharp move higher without a sustained trend, highlighted by a Stochastic RSI deep in the overbought zone at 99.39 while both RSI and CCI remain neutral. MACD signals strong buy momentum, but the overbought Stochastic RSI suggests the rally may be losing steam. The nearest support is the Ichimoku Kijun at $0.000003755, just below current price, and there is no published resistance above the recent highs.
Upside bias persists into next week with reversal risks below key support
For the next 7 days, the expected range is $0.000003577 to $0.00000456. There is a very high probability of an increase and a very low probability of a decrease. The base case is a pause or limited follow-through above support at $0.000003755, with potential for further upside if the move extends through the upper end of the expected range. A reversal below the Kijun support would open the way for a deeper pullback.
Earlier, analysts noted that Pepe’s recovery potential was limited by weak capital inflows and the need for new liquidity catalysts. The latest price action adds a new dimension as heightened volatility and institutional flows test support near $0.000003755, making the reaction at this level a key signal for short-term trend direction.










-
 Afghanistan
-
 Albania
-
 Algeria
-
 Angola
-
 Argentina
-
 Armenia
-
 Australia
-
 Austria
-
 Azerbaijan
-
 Bahamas
-
 Bahrain
-
 Bangladesh
-
 Belarus
-
 Belgium
-
 Bolivia
-
 Botswana
-
 Brazil
-
 Brunei
-
 Bulgaria
-
 Cambodia
-
 Cameroon
-
 Canada
-
 Chile
Chile
-
 China
China
-
 Colombia
-
 Congo
Congo
-
 Costa Rica
-
 Cote d'Ivoire
-
 Croatia
-
 Cuba
Cuba
-
 Cyprus
-
 Czechia
-
 DR Congo
-
 Denmark
-
 Dominican Republic
-
 Ecuador
-
 Egypt
Egypt
-
 El Salvador
-
 Estonia
-
 Eswatini
-
 Ethiopia
-
 Finland
-
 France
-
 Georgia
-
 Germany
-
 Ghana
Ghana
-
 Greece
-
 Haiti
Haiti
-
 Hong Kong
-
 Hungary
-
 India
India
-
 Indonesia
-
 Iran, Islamic republic
-
 Iraq
Iraq
-
 Ireland
-
 Israel
-
 Italy
Italy
-
 Jamaica
-
 Japan
Japan
-
 Jordan
-
 Kazakhstan
-
 Kenya
Kenya
-
 Korea
Korea
-
 Kuwait
-
 Kyrgyzstan
-
 Laos
Laos
-
 Latvia
-
 Lebanon
-
 Lesotho
-
 Libya
Libya
-
 Lithuania
-
 Luxembourg
-
 Madagascar
-
 Malaysia
-
 Malta
Malta
-
 Mauritius
-
 Mexico
-
 Moldova
-
 Mongolia
-
 Montenegro
-
 Morocco
-
 Mozambique
-
 Myanmar
-
 Namibia
-
 Nepal
Nepal
-
 Netherlands
-
 New Zealand
-
 Nigeria
-
 North Macedonia
-
 Norway
-
 Oman
Oman
-
 Pakistan
-
 Palestine
-
 Panama
-
 Papua New Guinea
-
 Paraguay
-
 Peru
Peru
-
 Philippines
-
 Poland
-
 Portugal
-
 Puerto Rico
-
 Qatar
Qatar
-
 Reunion
-
 Romania
-
 Rwanda
-
 Saudi Arabia
-
 Serbia
-
 Singapore
-
 Slovakia
-
 Slovenia
-
 Somalia
-
 South Africa
-
 Spain
Spain
-
 Sri Lanka
-
 Sweden
-
 Switzerland
-
 Syria
Syria
-
 Taiwan
-
 Tajikistan
-
 Tanzania
-
 Thailand
-
 Trinidad and Tobago
-
 Tunisia
-
 Turkey
-
 UAE
UAE
-
 Uganda
-
 Ukraine
-
 United Kingdom
-
United States
-
 Uruguay
-
 Uzbekistan
-
 Venezuela
-
 Vietnam
-
 Yemen
Yemen
-
 Zambia
-
 Zimbabwe
- Forex
- Crypto












