

Stellar technical analysis: Eyes on $0.2056 resistance amid institutional adoption news

Stellar (XLM) is trading at $0.1997 after a 7.31% gain today, with the move taking the asset above its key short- and medium-term moving averages, and keeping it well supported on the daily timeframe.
 0.1422
0.1506
Highlights
- Stellar Protocol 28 mainnet activation has updated minimum reserves, memos, staking offers, and holding periods, improving network functionality.
- Institutional support from S&P Global, Nasdaq, BNP Paribas, and Broadridge has raised XLM's profile through expanded tokenization and market data integration.
- XLM/USD trades with robust short- and medium-term trend signals and strong bullish momentum, with an expected range of $0.1936 to $0.2056 over the next 2 to 3 days.
Institutional demand rises as protocol 28 upgrade boosts engagement
Since September 16, Stellar Protocol 28 has been successfully activated on the mainnet, a development that has prompted XLM holders to review changes to minimum reserves, memos, staking offers, and the holding period, according to Cryptoticker. This protocol upgrade enhances network functionality, boosting user engagement and stimulating on-chain demand for XLM. In tandem, Stellar has broadened its tokenization initiatives by linking XLM to institutional market data, supported by KO funding led by S&P Global and joined by Nasdaq, BNP Paribas, and Broadridge, as reported by Allincrypto; this connection further elevates XLM's profile among institutional participants.
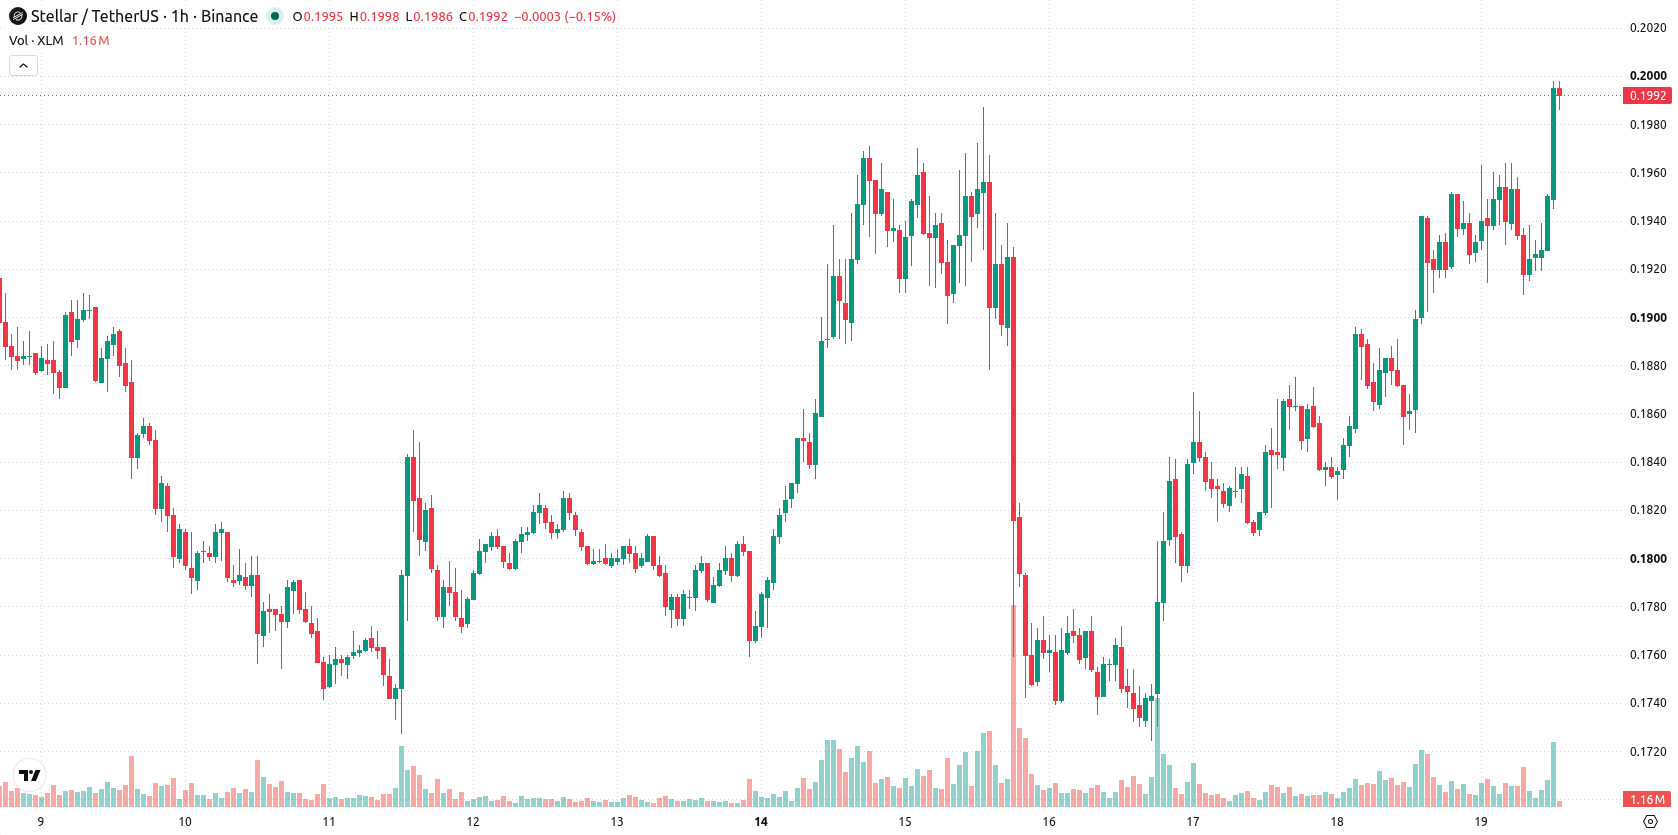
Bullish momentum holds as technical indicators show mixed signals
On the technical side, XLM/USD is trading above the MA-20 and MA-50 on the H1 chart and remains well above the MA-200 on the daily timeframe. The Ichimoku Kijun at $0.1906 serves as immediate support. Momentum readings are bullish: MACD signals Strong Buy and ADX indicates strong trend strength, while Bull/Bear Power confirms intraday buyer dominance. Meanwhile, RSI at 56, Stoch RSI, CCI, and the Awesome Oscillator all register as neutral, reflecting balanced oscillator conditions despite the price rally.
Upside favored as price range holds and downside risk remains limited
Looking ahead, XLM/USD is expected to trade within a range of $0.1936 to $0.2056 over the next two to three days. The likelihood of an upside continuation is very high, with a sideways scenario favored unless resistance is breached, which could trigger a move toward the upper boundary. A downside break below support would shift the scenario more negative, but this is currently viewed as a low probability event.
Earlier, analysts noted that Stellar’s technical upgrades and growing institutional involvement were driving a generally bullish outlook for XLM. The latest developments reinforce this view, with the successful activation of Protocol 28 and new institutional partnerships supporting a strong upside scenario in the $0.1936 to $0.2056 range for the coming days.








-
 Afghanistan
-
 Albania
-
 Algeria
-
 Angola
-
 Argentina
-
 Armenia
-
 Australia
-
 Austria
-
 Azerbaijan
-
 Bahamas
-
 Bahrain
-
 Bangladesh
-
 Belarus
-
 Belgium
-
 Bolivia
-
 Botswana
-
 Brazil
-
 Brunei
-
 Bulgaria
-
 Cambodia
-
 Cameroon
-
 Canada
-
 Chile
-
 China
-
 Colombia
-
 Congo
-
 Costa Rica
-
 Cote d'Ivoire
-
 Croatia
-
 Cuba
-
 Cyprus
-
 Czechia
-
 DR Congo
-
 Denmark
-
 Dominican Republic
-
 Ecuador
-
 Egypt
-
 El Salvador
-
 Estonia
-
 Eswatini
-
 Ethiopia
-
 Finland
-
 France
-
 Georgia
-
 Germany
-
 Ghana
-
 Greece
-
 Haiti
-
 Hong Kong
-
 Hungary
-
 India
-
 Indonesia
-
 Iran, Islamic republic
-
 Iraq
-
 Ireland
-
 Israel
-
 Italy
-
 Jamaica
-
 Japan
-
 Jordan
-
 Kazakhstan
-
 Kenya
-
 Korea
-
 Kuwait
-
 Kyrgyzstan
-
 Laos
-
 Latvia
-
 Lebanon
-
 Lesotho
-
 Libya
-
 Lithuania
-
 Luxembourg
-
 Madagascar
-
 Malaysia
-
 Malta
-
 Mauritius
-
 Mexico
-
 Moldova
-
 Mongolia
-
 Montenegro
-
 Morocco
-
 Mozambique
-
 Myanmar
-
 Namibia
-
 Nepal
-
 Netherlands
-
 New Zealand
-
 Nigeria
-
 North Macedonia
-
 Norway
-
 Oman
-
 Pakistan
-
 Palestine
-
 Panama
-
 Papua New Guinea
-
 Paraguay
-
 Peru
-
 Philippines
-
 Poland
-
 Portugal
-
 Puerto Rico
-
 Qatar
-
 Reunion
-
 Romania
-
 Rwanda
-
 Saudi Arabia
-
 Serbia
-
 Singapore
-
 Slovakia
-
 Slovenia
-
 Somalia
-
 South Africa
-
 Spain
-
 Sri Lanka
-
 Sweden
-
 Switzerland
-
 Syria
-
 Taiwan
-
 Tajikistan
-
 Tanzania
-
 Thailand
-
 Trinidad and Tobago
-
 Tunisia
-
 Turkey
-
 UAE
-
 Uganda
-
 Ukraine
-
 United Kingdom
-
United States
-
 Uruguay
-
 Uzbekistan
-
 Venezuela
-
 Vietnam
-
 Yemen
-
 Zambia
-
 Zimbabwe
- Forex
- Crypto












