

Pendle technical analysis: $2.3967 support under pressure from seller momentum

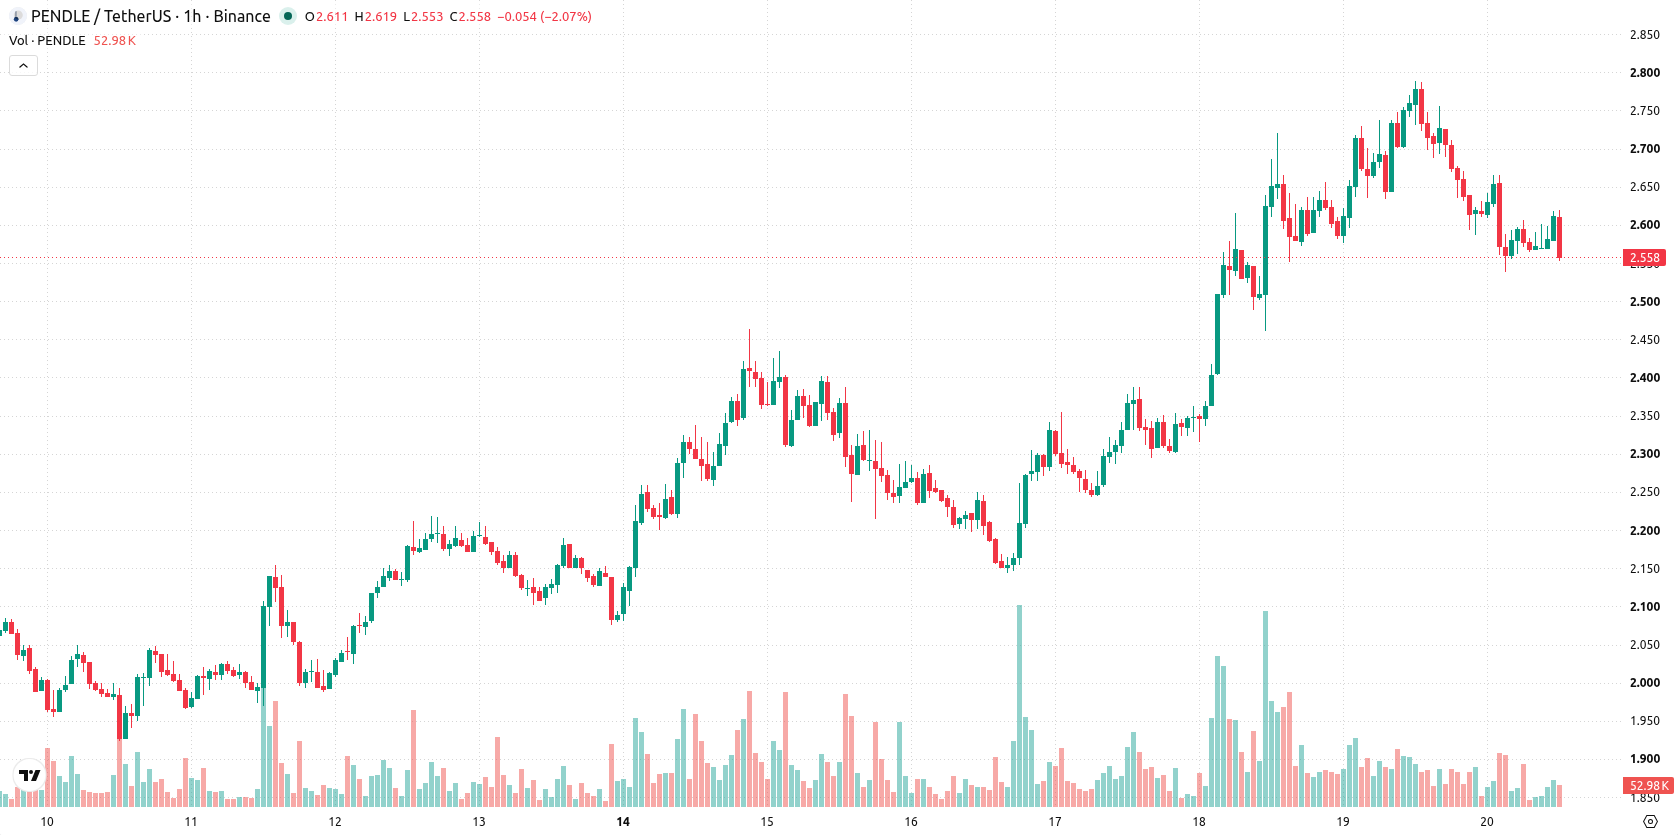
Pendle (PENDLE) is trading at $2.555, posting an 8.03% decline for the day. The asset is currently positioned below its key short- and medium-term moving averages yet holds above the long-term average, reflecting a divergence between current momentum and broader trend support levels.
 1.588
1.8410
Highlights
- Pendle completed the listing of NGI+, a tokenized asset tracking Partners Group's $1 billion infrastructure fund with a fixed 19% annual yield and a maturity date of December 10.
- The NGI+ listing brings a new yield-bearing instrument to the Pendle ecosystem, expanding product diversity and attracting institutional and DeFi participants.
- PENDLE/USD trades below short- and medium-term moving averages, with current high volatility and an expected 2.3967 to 2.846 range over the next two to three days.
Surging volumes and new listing as institutional interest grows
Pendle has completed the listing of NGI+, a tokenized asset tracking Partners Group's $1 billion infrastructure fund with a fixed annual yield of 19% and a stated maturity date of December 10, according to Startupfortune. This launch introduces a new yield-bearing instrument to the Pendle ecosystem, increasing the diversity of available products and potentially making the protocol more attractive to institutional and DeFi participants. Startupfortune also reported that on-chain trading volume surged to $2 billion in conjunction with the launch, highlighting a spike in user activity and liquidity for Pendle, though price action has remained under broader selling pressure.
Mixed momentum signals as price presses major resistance zones
The short-term technical setup for PENDLE centers around the MA-20 at $2.6151 and MA-50 at $2.6401 as immediate resistance levels, with the MA-200 providing longer-term support at $1.5002. The Ichimoku Kijun resistance is observed at $2.6635. Momentum signals are mixed: RSI is at 44.647 and CCI is on Sell, MACD shows a bearish reading, while ADX and Stochastic RSI remain Neutral. Bull/Bear Power indicates intraday seller strength, and the Awesome Oscillator is Neutral, underscoring the absence of a shared directional bias among key indicators.
Range-bound trading favored as probabilities tilt bullish
In the short term, PENDLE is expected to trade within a typical volatility band of $2.3967 to $2.846 over the next two to three sessions. Model probabilities assign a 63% chance to an upside move versus a 37% risk of a breakdown. Should the price break above $2.6635 resistance, a bullish scenario may unfold, while a close below $2.3967 support could lead to further downside pressure. The baseline expectation is for price consolidation between clearly defined support and resistance levels.
Earlier, analysts noted that Pendle was demonstrating strong bullish momentum supported by favorable technical setups and growing access to real-world asset offerings. The current article signals a shift, as the asset now faces mounting resistance and short-term downward pressure despite increased product diversity, with attention focused on the $2.6635 resistance and $2.3967 support as the pivotal levels for upcoming price action.











-
 Afghanistan
-
 Albania
-
 Algeria
-
 Angola
-
 Argentina
-
 Armenia
-
 Australia
-
 Austria
-
 Azerbaijan
-
 Bahamas
-
 Bahrain
-
 Bangladesh
-
 Belarus
-
 Belgium
-
 Bolivia
-
 Botswana
-
 Brazil
-
 Brunei
-
 Bulgaria
-
 Cambodia
-
 Cameroon
-
 Canada
-
 Chile
-
 China
-
 Colombia
-
 Congo
-
 Costa Rica
-
 Cote d'Ivoire
-
 Croatia
-
 Cuba
-
 Cyprus
-
 Czechia
-
 DR Congo
-
 Denmark
-
 Dominican Republic
-
 Ecuador
-
 Egypt
-
 El Salvador
-
 Estonia
-
 Eswatini
-
 Ethiopia
-
 Finland
-
 France
-
 Georgia
-
 Germany
-
 Ghana
-
 Greece
-
 Haiti
-
 Hong Kong
-
 Hungary
-
 India
-
 Indonesia
-
 Iran, Islamic republic
-
 Iraq
-
 Ireland
-
 Israel
-
 Italy
-
 Jamaica
-
 Japan
-
 Jordan
-
 Kazakhstan
-
 Kenya
-
 Korea
-
 Kuwait
-
 Kyrgyzstan
-
 Laos
-
 Latvia
-
 Lebanon
-
 Lesotho
-
 Libya
-
 Lithuania
-
 Luxembourg
-
 Madagascar
-
 Malaysia
-
 Malta
-
 Mauritius
-
 Mexico
-
 Moldova
-
 Mongolia
-
 Montenegro
-
 Morocco
-
 Mozambique
-
 Myanmar
-
 Namibia
-
 Nepal
-
 Netherlands
-
 New Zealand
-
 Nigeria
-
 North Macedonia
-
 Norway
-
 Oman
-
 Pakistan
-
 Palestine
-
 Panama
-
 Papua New Guinea
-
 Paraguay
-
 Peru
-
 Philippines
-
 Poland
-
 Portugal
-
 Puerto Rico
-
 Qatar
-
 Reunion
-
 Romania
-
 Rwanda
-
 Saudi Arabia
-
 Serbia
-
 Singapore
-
 Slovakia
-
 Slovenia
-
 Somalia
-
 South Africa
-
 Spain
-
 Sri Lanka
-
 Sweden
-
 Switzerland
-
 Syria
-
 Taiwan
-
 Tajikistan
-
 Tanzania
-
 Thailand
-
 Trinidad and Tobago
-
 Tunisia
-
 Turkey
-
 UAE
-
 Uganda
-
 Ukraine
-
 United Kingdom
-
United States
-
 Uruguay
-
 Uzbekistan
-
 Venezuela
-
 Vietnam
-
 Yemen
-
 Zambia
-
 Zimbabwe
- Forex
- Crypto












