

Pendle breakout attempt at $2.882 resistance: Upside targets to watch

Pendle (PENDLE) is trading at $2.738, up 8.52% on the day and near the session high. The asset is positioned above its key moving averages, reflecting notable upward momentum in the short and medium term.
 1.469
1.5630
Highlights
- Pendle surged after introducing the tokenized $1 billion NGI+ Partners Group infrastructure fund, significantly increasing institutional-grade offerings and platform appeal.
- NGI+ provides participants an initial fixed yield of about 19%, and Pendle emissions have dropped 92% year-to-date, with annual inflation at 0.2%.
- Pendle trades with strong bullish signals; price is up 8.52% and is forecast to move within $2.594 to $2.882 over the next 2 to 3 days.
Fund tokenization and buybacks tighten market as volume surges
Pendle’s surge is driven by its launch of the tokenized USD $1 billion Partners Group infrastructure fund (NGI+) on September 18, 2026, which significantly expanded the platform’s institutional-grade offerings and coincided with trading volumes rising over 90% above the 30-day average. The introduction of NGI+, a fund managed by Partners Group and tokenized by AssetoFinance, provides participants with an initial fixed yield of around 19%, according to DiarioBitcoin and Kucoin, directly enhancing the project’s appeal to yield-seeking users. Additionally, Pendle’s tokenomics have undergone a marked shift, with emissions down 92% year-to-date, annual inflation at 0.2%, and buybacks exceeding new supply by roughly tenfold, reinforcing structurally tighter market conditions.
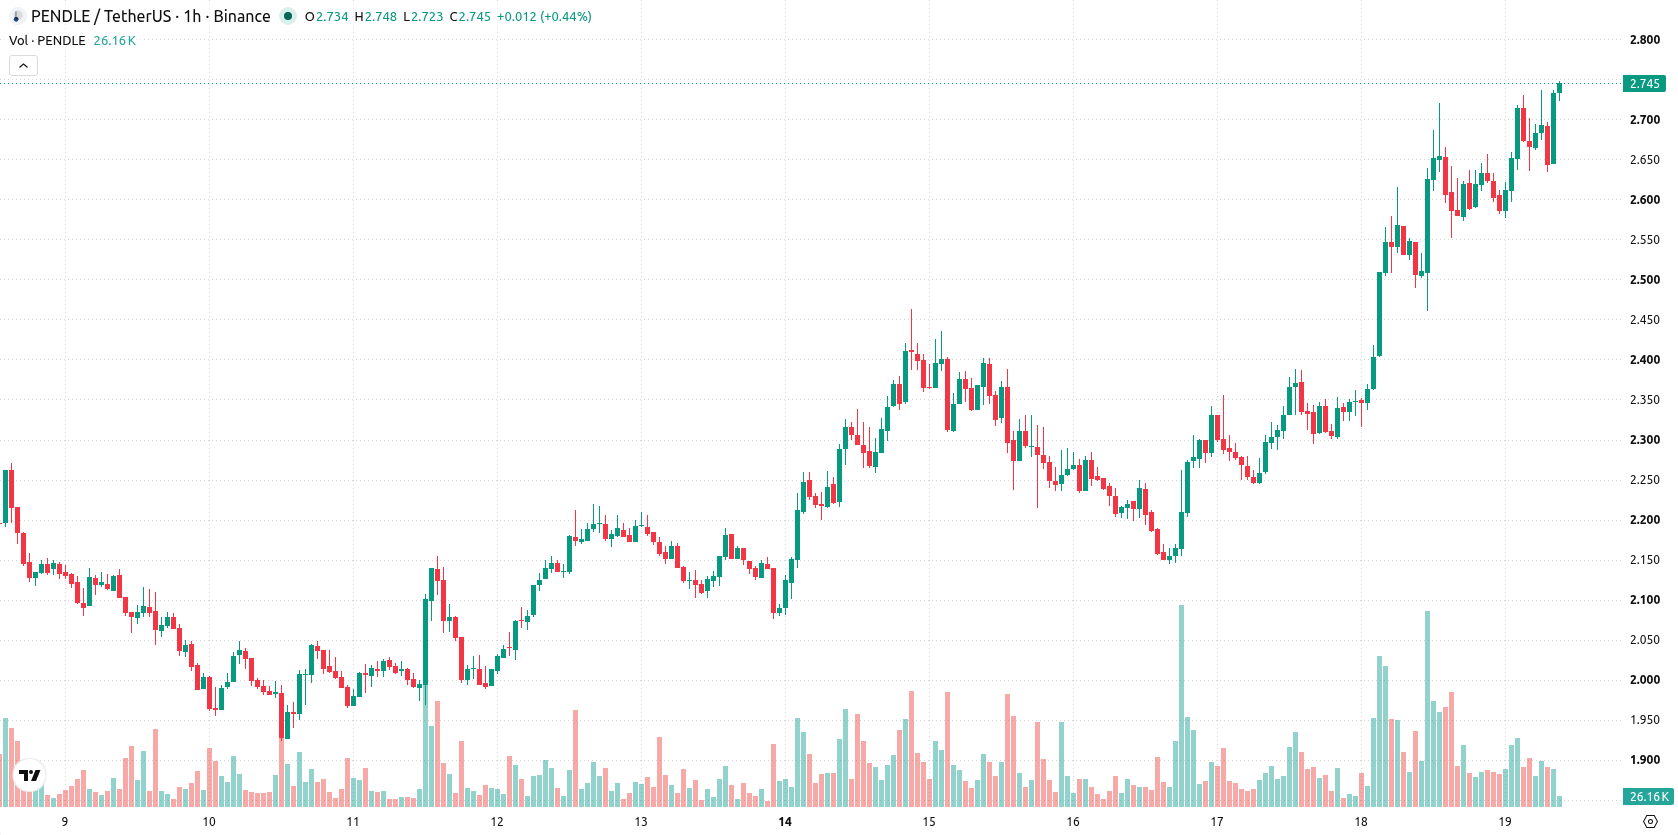
Bullish momentum confirmed as technical supports hold firm
On the hourly chart, PENDLE trades above the MA-20 and MA-50, and is well clear of the MA-200, confirming a strong bullish technical setup. The Ichimoku Kijun sits at $2.599, acting as immediate support. MACD stands in Strong Buy territory, while the ADX indicates ongoing buy conditions. RSI remains in the Buy zone and Stoch RSI signals an oversold reading, indicating room for further moves. CCI is currently neutral, providing a mixed view on overextension. Bull/Bear Power is dominantly positive, confirming upward pressure intraday. The Awesome Oscillator is neutral and does not reinforce trend conviction.
Upside bias persists unless price falls below key range support
Looking ahead 2–3 trading days, PENDLE is projected to move within the $2.594 to $2.882 range. The probability of further upside remains very high, with only a low chance of a meaningful reversal. The baseline scenario anticipates consolidation or sideways movement within this typical volatility band, while a break above $2.882 would indicate bullish continuation. Conversely, a drop below $2.594 support would signal a potential trend reversal.
In a recent review, analysts highlighted Pendle's bullish momentum supported by increasing access to real-world assets and favorable technical conditions. The current setup further reinforces this positive trend, with traders advised to monitor the $2.594 support for signs of a potential reversal or a sustained move higher if resistance at $2.882 is breached.










-
 Afghanistan
-
 Albania
-
 Algeria
-
 Angola
-
 Argentina
-
 Armenia
-
 Australia
-
 Austria
-
 Azerbaijan
-
 Bahamas
-
 Bahrain
-
 Bangladesh
-
 Belarus
-
 Belgium
-
 Bolivia
-
 Botswana
-
 Brazil
-
 Brunei
-
 Bulgaria
-
 Cambodia
-
 Cameroon
-
 Canada
-
 Chile
-
 China
-
 Colombia
-
 Congo
-
 Costa Rica
-
 Cote d'Ivoire
-
 Croatia
-
 Cuba
-
 Cyprus
-
 Czechia
-
 DR Congo
-
 Denmark
-
 Dominican Republic
-
 Ecuador
-
 Egypt
-
 El Salvador
-
 Estonia
-
 Eswatini
-
 Ethiopia
-
 Finland
-
 France
-
 Georgia
-
 Germany
-
 Ghana
-
 Greece
-
 Haiti
-
 Hong Kong
-
 Hungary
-
 India
-
 Indonesia
-
 Iran, Islamic republic
-
 Iraq
-
 Ireland
-
 Israel
-
 Italy
-
 Jamaica
-
 Japan
-
 Jordan
-
 Kazakhstan
-
 Kenya
-
 Korea
-
 Kuwait
-
 Kyrgyzstan
-
 Laos
-
 Latvia
-
 Lebanon
-
 Lesotho
-
 Libya
-
 Lithuania
-
 Luxembourg
-
 Madagascar
-
 Malaysia
-
 Malta
-
 Mauritius
-
 Mexico
-
 Moldova
-
 Mongolia
-
 Montenegro
-
 Morocco
-
 Mozambique
-
 Myanmar
-
 Namibia
-
 Nepal
-
 Netherlands
-
 New Zealand
-
 Nigeria
-
 North Macedonia
-
 Norway
-
 Oman
-
 Pakistan
-
 Palestine
-
 Panama
-
 Papua New Guinea
-
 Paraguay
-
 Peru
-
 Philippines
-
 Poland
-
 Portugal
-
 Puerto Rico
-
 Qatar
-
 Reunion
-
 Romania
-
 Rwanda
-
 Saudi Arabia
-
 Serbia
-
 Singapore
-
 Slovakia
-
 Slovenia
-
 Somalia
-
 South Africa
-
 Spain
-
 Sri Lanka
-
 Sweden
-
 Switzerland
-
 Syria
-
 Taiwan
-
 Tajikistan
-
 Tanzania
-
 Thailand
-
 Trinidad and Tobago
-
 Tunisia
-
 Turkey
-
 UAE
-
 Uganda
-
 Ukraine
-
 United Kingdom
-
United States
-
 Uruguay
-
 Uzbekistan
-
 Venezuela
-
 Vietnam
-
 Yemen
-
 Zambia
-
 Zimbabwe
- Forex
- Crypto












