

Curve gains almost 10% after strong technical trend strength dominates trading

Curve (CRV) surged 9.73% on the back of strong bullish momentum and sustained buying pressure. The move is reinforced by the token trading above its short-, medium-, and long-term moving averages, which emphasizes support from technical trend strength.
 0.2074
0.2713
Highlights
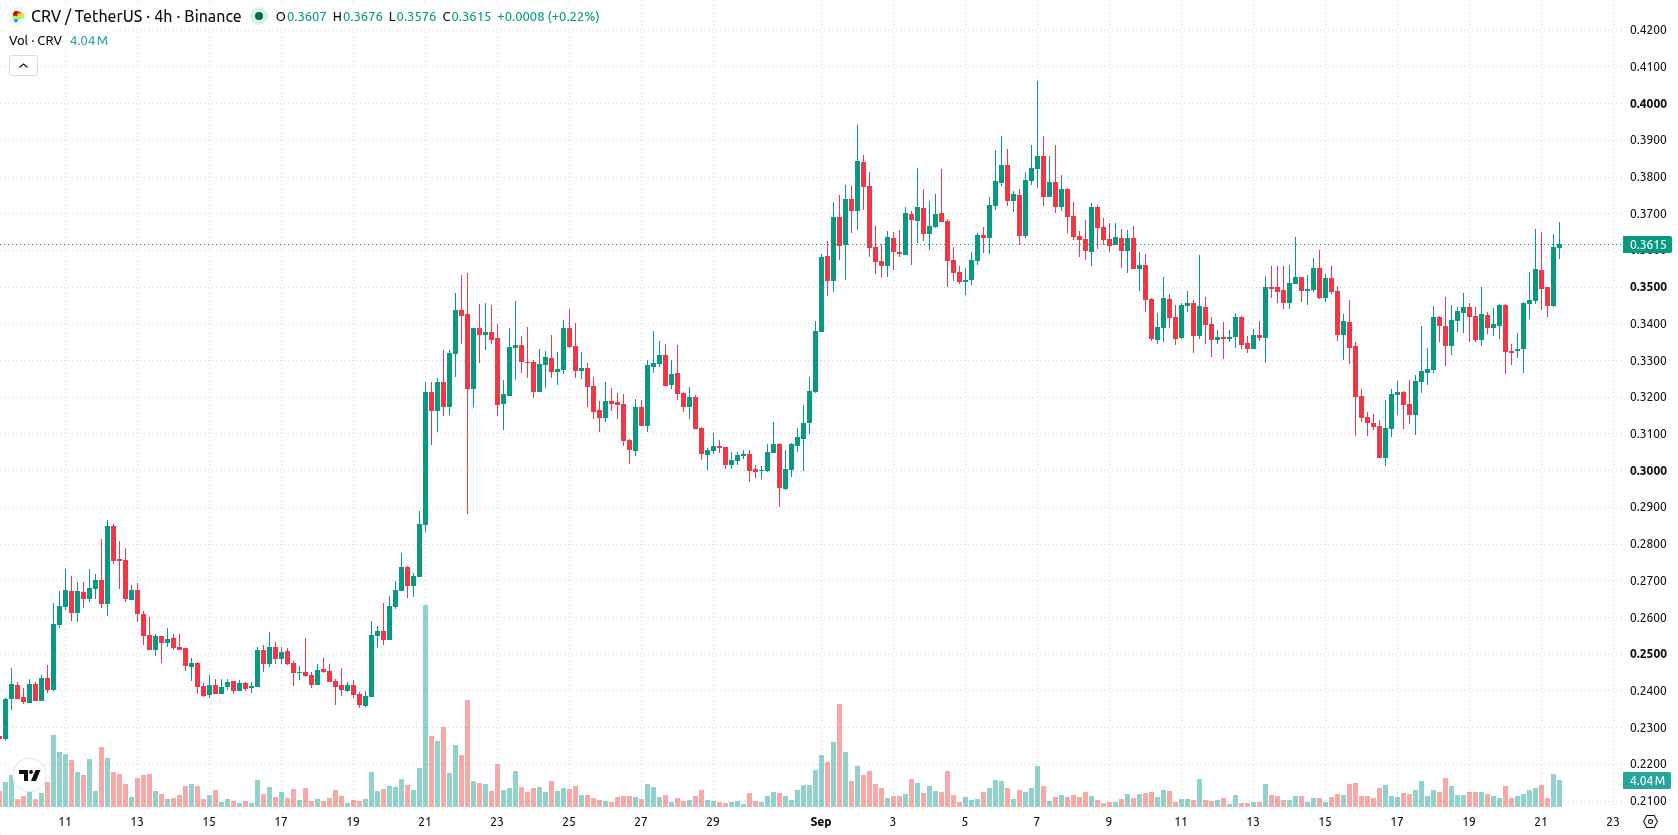
- CRV/USD maintains bullish momentum above key moving averages, trading near the upper end of its range at $0.365.
- Momentum and trend signals register strong or constructive, with no overbought readings and intraday buyer dominance noted.
- The forecast range for the next five sessions is $0.3186 to $0.3943, with a very high probability of an upward move.
Upper-range pressure builds as bullish momentum meets neutral signals
CRV/USD is trading above its 20-day, 50-day, and 200-day moving averages at $0.3503, $0.3014, and $0.2421, respectively, highlighting sustained short-, medium-, and long-term bullish momentum. The price is currently near the near-term ceiling at $0.365, with the 20-day moving average at $0.3503 acting as the near-term floor and the Ichimoku Kijun at $0.3481 providing additional support. The alignment of the MA-50 above the MA-200 confirms a bullish longer-term trend. Momentum signals remain broadly constructive, with both the MACD and the ADX indicating a strong buy. The RSI at 57.08 and Stochastic RSI at 56.33 are neutral, showing neither overbought nor oversold conditions, while the CCI at -33.54 also reflects a neutral stance. Bull/Bear Power signals active intraday buyer dominance. The daily gain of $0.0321 (9.73%) is accompanied by an upside gap of $0.0247 (7.49%), and the price is near session highs amid 6.79% intraday volatility. Overall intraday tone is bullish, with continued momentum toward the upper range.
Earlier, analysts noted that Curve was demonstrating strong bullish momentum with key technical signals supporting the upside scenario. The latest data affirms this prevailing bullish outlook, making a breakout above $0.365 an important trigger level for potential gains toward the upper end of the projected volatility band.









-
 Afghanistan
-
 Albania
-
 Algeria
-
 Angola
-
 Argentina
-
 Armenia
-
 Australia
-
 Austria
-
 Azerbaijan
-
 Bahamas
-
 Bahrain
-
 Bangladesh
-
 Belarus
-
 Belgium
-
 Bolivia
-
 Botswana
-
 Brazil
-
 Brunei
-
 Bulgaria
-
 Cambodia
-
 Cameroon
-
 Canada
-
 Chile
-
 China
-
 Colombia
-
 Congo
-
 Costa Rica
-
 Cote d'Ivoire
-
 Croatia
-
 Cuba
-
 Cyprus
-
 Czechia
-
 DR Congo
-
 Denmark
-
 Dominican Republic
-
 Ecuador
-
 Egypt
-
 El Salvador
-
 Estonia
-
 Eswatini
-
 Ethiopia
-
 Finland
-
 France
-
 Georgia
-
 Germany
-
 Ghana
-
 Greece
-
 Haiti
-
 Hong Kong
-
 Hungary
-
 India
-
 Indonesia
-
 Iran, Islamic republic
-
 Iraq
-
 Ireland
-
 Israel
-
 Italy
-
 Jamaica
-
 Japan
-
 Jordan
-
 Kazakhstan
-
 Kenya
-
 Korea
-
 Kuwait
-
 Kyrgyzstan
-
 Laos
-
 Latvia
-
 Lebanon
-
 Lesotho
-
 Libya
-
 Lithuania
-
 Luxembourg
-
 Madagascar
-
 Malaysia
-
 Malta
-
 Mauritius
-
 Mexico
-
 Moldova
-
 Mongolia
-
 Montenegro
-
 Morocco
-
 Mozambique
-
 Myanmar
-
 Namibia
-
 Nepal
-
 Netherlands
-
 New Zealand
-
 Nigeria
-
 North Macedonia
-
 Norway
-
 Oman
-
 Pakistan
-
 Palestine
-
 Panama
-
 Papua New Guinea
-
 Paraguay
-
 Peru
-
 Philippines
-
 Poland
-
 Portugal
-
 Puerto Rico
-
 Qatar
-
 Reunion
-
 Romania
-
 Rwanda
-
 Saudi Arabia
-
 Serbia
-
 Singapore
-
 Slovakia
-
 Slovenia
-
 Somalia
-
 South Africa
-
 Spain
-
 Sri Lanka
-
 Sweden
-
 Switzerland
-
 Syria
-
 Taiwan
-
 Tajikistan
-
 Tanzania
-
 Thailand
-
 Trinidad and Tobago
-
 Tunisia
-
 Turkey
-
 UAE
-
 Uganda
-
 Ukraine
-
 United Kingdom
-
United States
-
 Uruguay
-
 Uzbekistan
-
 Venezuela
-
 Vietnam
-
 Yemen
-
 Zambia
-
 Zimbabwe
- Forex
- Crypto












