

Curve technical analysis: Bearish momentum persists with $0.2019 support at risk

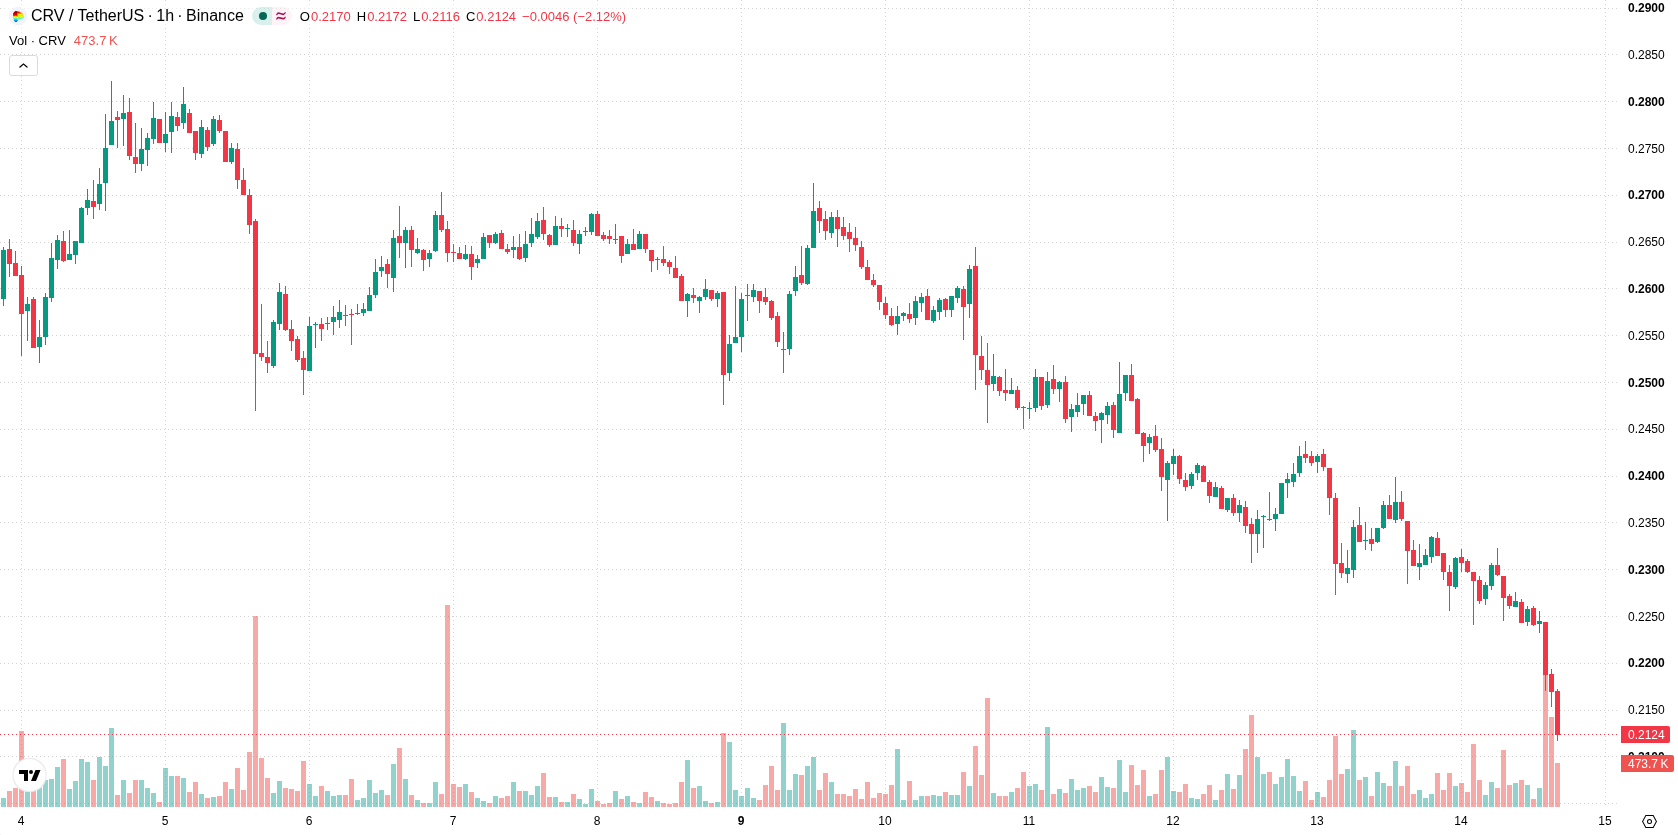
Curve (CRV) is trading at $0.2121, posting a daily loss of 8.81%. The asset remains below its key moving averages, reflecting ongoing intraday weakness.
 0.1808
0.2119
Highlights
- CRV/USD trades below key moving averages with persistent selling pressure across short, medium, and long timeframes.
- Momentum indicators such as MACD, ADX, and oscillators remain negative or oversold, with intraday sellers in control and no confirmed reversal.
- Price dropped to $0.2121, down 8.81% for the day, and is projected to trade between $0.2019 and $0.2223 over the next 2 to 3 days.
Persistent bearish momentum as oversold readings fail to trigger reversal
On the hourly chart, CRV continues to hold below the SMA-20, SMA-50, and SMA-200 moving averages, underlining short-, medium-, and long-term weakness. The Ichimoku Kijun level at $0.2277 currently acts as immediate resistance. Momentum signals remain decisively negative—MACD and ADX indicate a persistently bearish environment. RSI, Stochastic RSI, and CCI all reside within their oversold areas, pointing to potential selling exhaustion but not confirming any reversal. Intraday, Bull/Bear Power stays negative and the Awesome Oscillator aligns with the prevailing downtrend.
Downside risk dominates as consolidation expected within narrow band
Over the next two to three trading days, CRV is likely to trade between $0.2019 and $0.2223, representing a volatility band relative to current levels. The probability of an upward move is considered very low, whereas the risk of further downside remains high with a significant chance of the downtrend continuing. The baseline scenario involves consolidation within this range. If price breaks above $0.2277, some retracement may unfold; a fall below $0.2019 would extend the intraday decline.
Earlier, analysts noted that Curve faced ongoing downside risk as sellers maintained control and technical signals pointed to a negative outlook. The latest price action reinforces this bearish scenario, with traders advised to monitor the $0.2019 level as a potential trigger for further downside in the near term.









-
 Afghanistan
-
 Albania
-
 Algeria
-
 Angola
-
 Argentina
-
 Armenia
-
 Australia
-
 Austria
-
 Azerbaijan
-
 Bahamas
-
 Bahrain
-
 Bangladesh
-
 Belarus
-
 Belgium
-
 Bolivia
-
 Botswana
-
 Brazil
-
 Brunei
-
 Bulgaria
-
 Cambodia
-
 Cameroon
-
 Canada
-
 Chile
-
 China
-
 Colombia
-
 Congo
-
 Costa Rica
-
 Cote d'Ivoire
-
 Croatia
-
 Cuba
-
 Cyprus
-
 Czechia
-
 DR Congo
-
 Denmark
-
 Dominican Republic
-
 Ecuador
-
 Egypt
-
 El Salvador
-
 Estonia
-
 Eswatini
-
 Ethiopia
-
 Finland
-
 France
-
 Georgia
-
 Germany
-
 Ghana
-
 Greece
-
 Haiti
-
 Hong Kong
-
 Hungary
-
 India
-
 Indonesia
-
 Iran, Islamic republic
-
 Iraq
-
 Ireland
-
 Israel
-
 Italy
-
 Jamaica
-
 Japan
-
 Jordan
-
 Kazakhstan
-
 Kenya
-
 Korea
-
 Kuwait
-
 Kyrgyzstan
-
 Laos
-
 Latvia
-
 Lebanon
-
 Lesotho
-
 Libya
-
 Lithuania
-
 Luxembourg
-
 Madagascar
-
 Malaysia
-
 Malta
-
 Mauritius
-
 Mexico
-
 Moldova
-
 Mongolia
-
 Montenegro
-
 Morocco
-
 Mozambique
-
 Myanmar
-
 Namibia
-
 Nepal
-
 Netherlands
-
 New Zealand
-
 Nigeria
-
 North Macedonia
-
 Norway
-
 Oman
-
 Pakistan
-
 Palestine
-
 Panama
-
 Papua New Guinea
-
 Paraguay
-
 Peru
-
 Philippines
-
 Poland
-
 Portugal
-
 Puerto Rico
-
 Qatar
-
 Reunion
-
 Romania
-
 Rwanda
-
 Saudi Arabia
-
 Serbia
-
 Singapore
-
 Slovakia
-
 Slovenia
-
 Somalia
-
 South Africa
-
 Spain
-
 Sri Lanka
-
 Sweden
-
 Switzerland
-
 Syria
-
 Taiwan
-
 Tajikistan
-
 Tanzania
-
 Thailand
-
 Trinidad and Tobago
-
 Tunisia
-
 Turkey
-
 UAE
-
 Uganda
-
 Ukraine
-
 United Kingdom
-
United States
-
 Uruguay
-
 Uzbekistan
-
 Venezuela
-
 Vietnam
-
 Yemen
-
 Zambia
-
 Zimbabwe
- Forex
- Crypto












