

Nexo weekly forecast: Overbought signals from major oscillators cap advance despite firm trend

Nexo (NEXO) is trading around $0.86 after advancing nearly 7% in the past week, as momentum has built alongside a surge in corporate activity. With a rally now running into overbought conditions, traders are watching for signs that buyer enthusiasm may cool or reset across the coming week.
 0.681
0.7450
Highlights
- Nexo trades at $0.864 after climbing $0.056 in the past week, maintaining a positive price structure within its recent range.
- Technical signals indicate sustained upside momentum with a strong trend, but oscillators warn the token is overbought and may face short-term pullbacks.
- Nexo is projected to trade between $0.8052 and $0.9227 this week, with key support at $0.8335 and resistance at $0.889.
Expanded U.S. stock access stirs sentiment as trading options broaden
Nexo introduced expanded trading options, enabling platform users to buy and sell over 460 U.S. stocks and ETFs alongside their crypto, according to Nexo's official blog. This update includes fractional investing from $10, 24/5 access, and support for borrowing against stock holdings, aimed at boosting platform engagement and product diversity. As users react to the broader range of available assets, attention will remain on how these features influence market activity and sentiment in the week ahead.
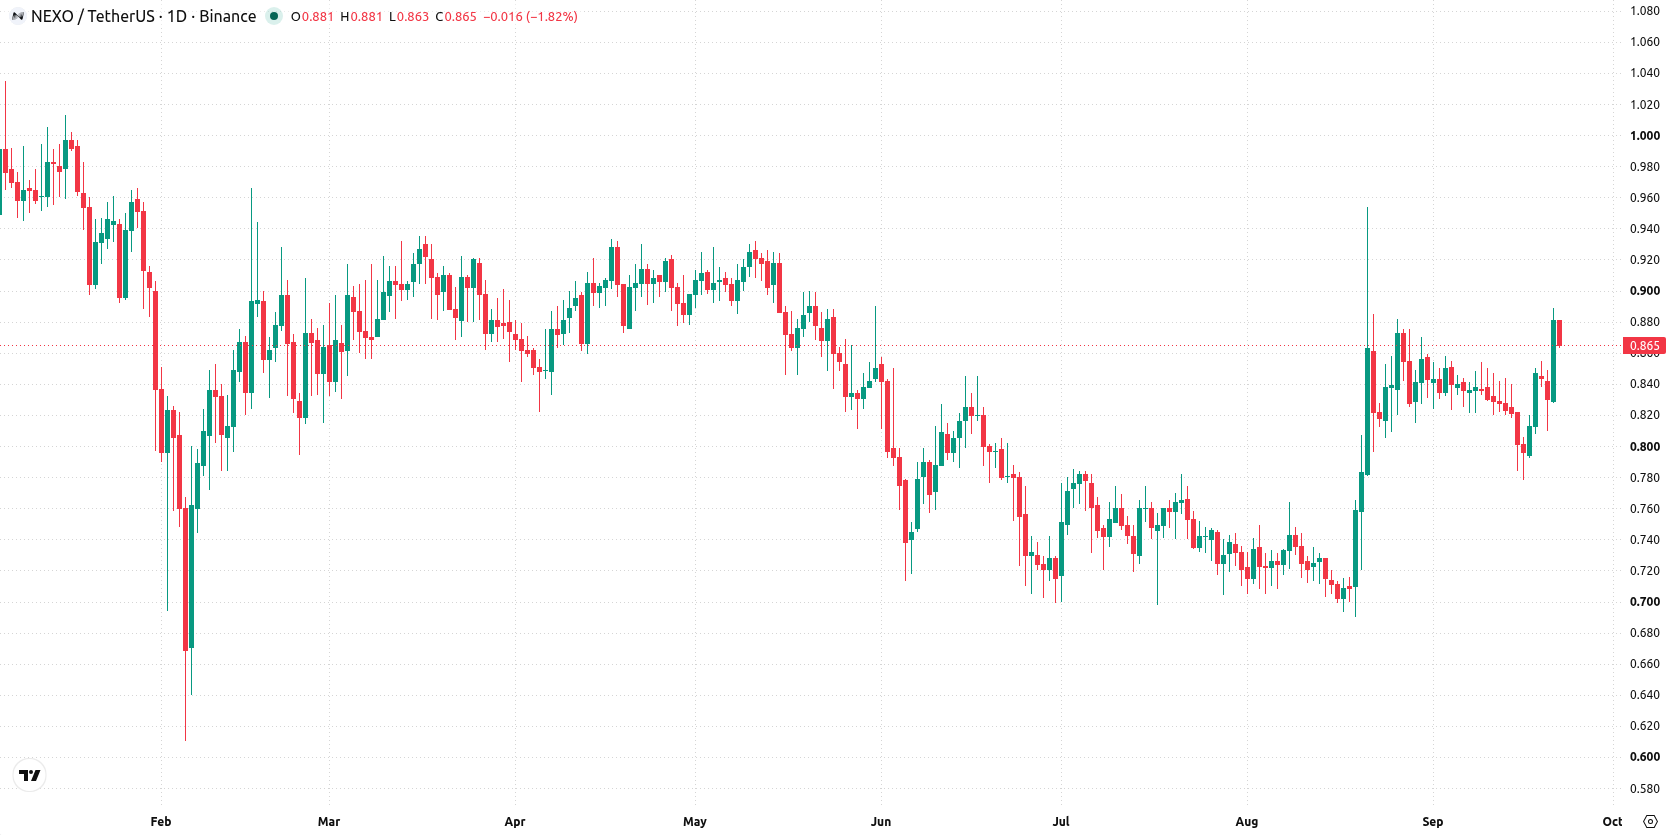
Momentum persists as overbought signals stack and ADX confirms trend
The daily chart shows a sustained move higher with a firm trend, as confirmed by a strong Bull/Bear Power reading and support from the ADX at 31.9146. All three major oscillators flag overheating signals, with CCI and Stochastic RSI both in the overbought zone, while RSI is approaching overbought at 65.6093. Volatility reached 14.27% last week, providing room for rapid swings. Immediate support is marked by the Ichimoku Kijun at $0.8335, while resistance lies at $0.889. This setup points to a directional bias to the upside, but overextended oscillators suggest the potential for short-term pullbacks.
Upside bias holds unless support fails during potential breakout week
In the week ahead, Nexo is expected to trade between $0.8052 and $0.9227. There is a very high probability (more than 80%) of further gains, with a very low probability (less than 20%) of a decline. The base case sees range-bound action between support at $0.8335 and resistance at $0.889. A break above $0.889 signals renewed bullish momentum toward $0.9227, while a drop below $0.8335 would negate the current trend and open a path toward the lower range of $0.8052.
Earlier, analysts noted that Nexo's strong technical resilience and momentum were underpinning its bullish trend. The current analysis adds fresh context by highlighting elevated volatility and overbought conditions, making $0.8335 a crucial support level to watch for any signs of a directional shift in the days ahead.






Latest Nexo News




-
 Afghanistan
-
 Albania
-
 Algeria
-
 Angola
-
 Argentina
-
 Armenia
-
 Australia
-
 Austria
-
 Azerbaijan
-
 Bahamas
-
 Bahrain
-
 Bangladesh
-
 Belarus
-
 Belgium
-
 Bolivia
-
 Botswana
-
 Brazil
-
 Brunei
-
 Bulgaria
-
 Cambodia
-
 Cameroon
-
 Canada
-
 Chile
-
 China
-
 Colombia
-
 Congo
-
 Costa Rica
-
 Cote d'Ivoire
-
 Croatia
-
 Cuba
-
 Cyprus
-
 Czechia
-
 DR Congo
-
 Denmark
-
 Dominican Republic
-
 Ecuador
-
 Egypt
-
 El Salvador
-
 Estonia
-
 Eswatini
-
 Ethiopia
-
 Finland
-
 France
-
 Georgia
-
 Germany
-
 Ghana
-
 Greece
-
 Haiti
-
 Hong Kong
-
 Hungary
-
 India
-
 Indonesia
-
 Iran, Islamic republic
-
 Iraq
-
 Ireland
-
 Israel
-
 Italy
-
 Jamaica
-
 Japan
-
 Jordan
-
 Kazakhstan
-
 Kenya
-
 Korea
-
 Kuwait
-
 Kyrgyzstan
-
 Laos
-
 Latvia
-
 Lebanon
-
 Lesotho
-
 Libya
-
 Lithuania
-
 Luxembourg
-
 Madagascar
-
 Malaysia
-
 Malta
-
 Mauritius
-
 Mexico
-
 Moldova
-
 Mongolia
-
 Montenegro
-
 Morocco
-
 Mozambique
-
 Myanmar
-
 Namibia
-
 Nepal
-
 Netherlands
-
 New Zealand
-
 Nigeria
-
 North Macedonia
-
 Norway
-
 Oman
-
 Pakistan
-
 Palestine
-
 Panama
-
 Papua New Guinea
-
 Paraguay
-
 Peru
-
 Philippines
-
 Poland
-
 Portugal
-
 Puerto Rico
-
 Qatar
-
 Reunion
-
 Romania
-
 Rwanda
-
 Saudi Arabia
-
 Serbia
-
 Singapore
-
 Slovakia
-
 Slovenia
-
 Somalia
-
 South Africa
-
 Spain
-
 Sri Lanka
-
 Sweden
-
 Switzerland
-
 Syria
-
 Taiwan
-
 Tajikistan
-
 Tanzania
-
 Thailand
-
 Trinidad and Tobago
-
 Tunisia
-
 Turkey
-
 UAE
-
 Uganda
-
 Ukraine
-
 United Kingdom
-
United States
-
 Uruguay
-
 Uzbekistan
-
 Venezuela
-
 Vietnam
-
 Yemen
-
 Zambia
-
 Zimbabwe
- Forex
- Crypto












