

Why is Bitcoin down today? Selloff and downside targets in focus

Bitcoin (BTC) is trading at $83,978, ending the day down 2.89%. The price sits below its key short- and medium-term moving averages but remains above its long-term average.
 65392.01
75442.01
Highlights
- Bitcoin spot ETFs drew $999 million in inflows, reaching a 2026 high and expanding regulated market liquidity.
- Short position liquidations between $648 million and $920 million added to trading volume during the same period.
- BTC/USD trades below key short- and medium-term averages with momentum indicators negative and a projected range of $81,496 to $88,360 over the next 2 to 3 days.
Institutional inflows surge as selling pressure persists
On September 21, 2026, Bitcoin spot ETFs recorded $999 million in inflows, setting a new high for the year, as reported by Techtimes. This influx of capital through regulated products expanded available market liquidity, with additional short liquidations between $648 million and $920 million forcing traders to cover positions and drive further volume, according to Techtimes. Persistent net inflows across US spot Bitcoin ETFs, as noted by Cryptoticker and Kucoin, reflected ongoing institutional and investor interest, though price action has remained under broader selling pressure.
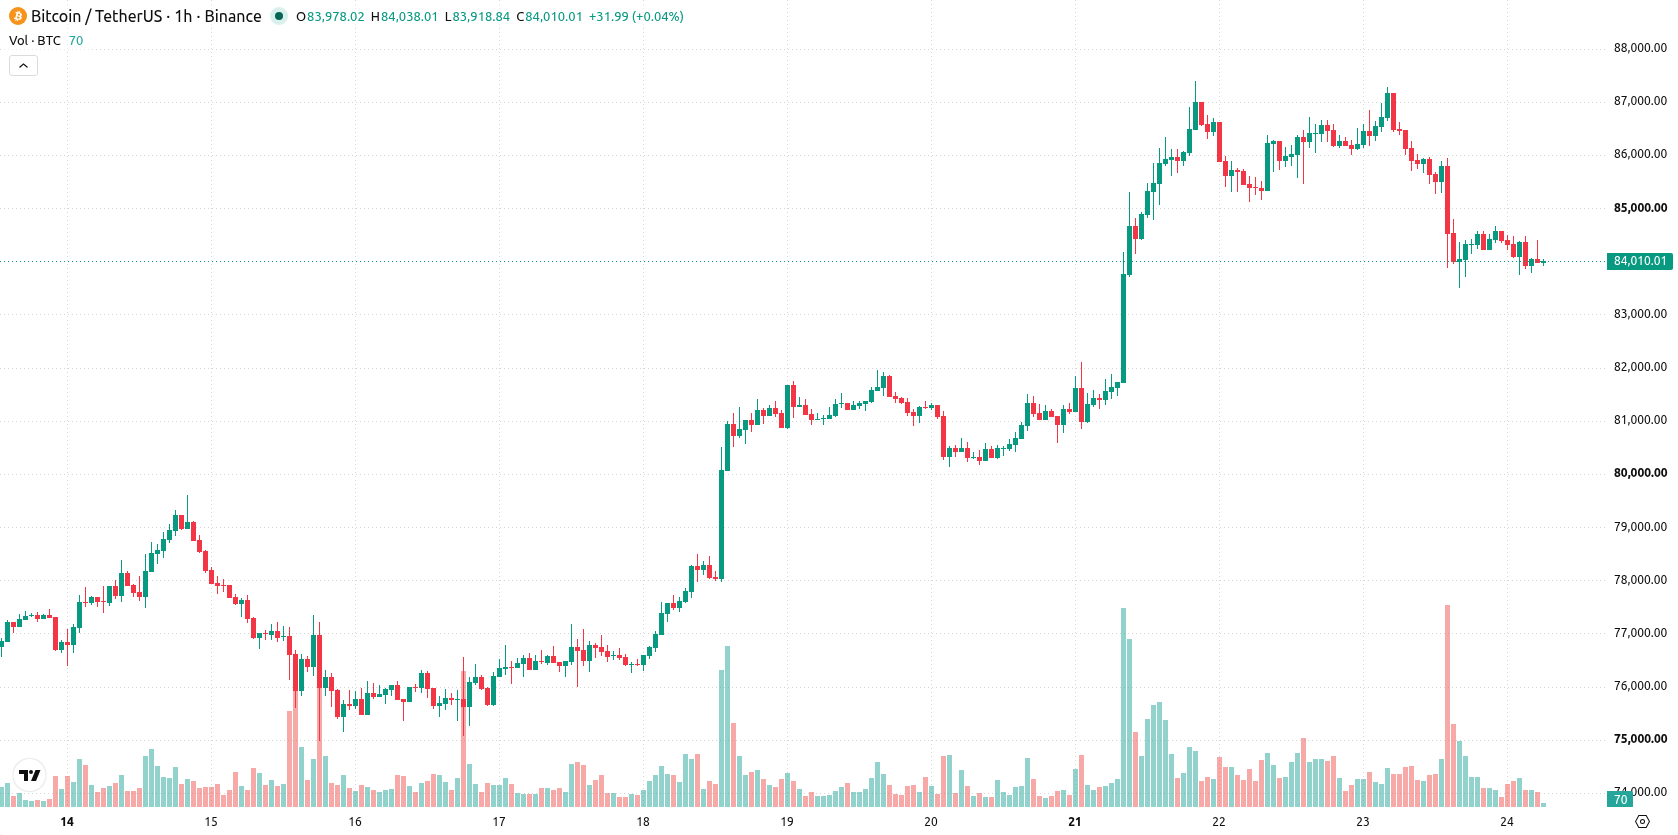
Negative momentum signals as resistance and support converge
BTC/USD currently sits below its MA-20 at $84,632 and MA-50 at $85,559 on the hourly timeframe, while still holding above the MA-200 at $70,795 on the daily chart. Immediate resistance is defined by the Ichimoku Kijun at $85,389, and near-term support is seen at $81,496. Momentum signals are uniformly negative: MACD and ADX both issue sell signals, RSI stands at 33.86 in oversold territory, and CCI, Stochastic RSI, and Bull/Bear Power all confirm persistent selling activity. The Awesome Oscillator reinforces this view, as intraday momentum and oscillator signals continue to align with prevailing weakness.
Downside risk prevails as range-bound trading expected
Over the next 2–3 days, BTC/USD is expected to trade within the $81,496 to $88,360 corridor, reflecting the typical volatility band relative to current levels. The probability of a further move lower is elevated, with downside risk assessed at 79% versus a 21% chance of a short-term rebound. The baseline scenario calls for a sideways consolidation within this range; a bullish reversal would require a sustained break above $85,389, while a failure of support at $81,496 would likely trigger a continuation of the downward trend.
Earlier, analysts noted that Bitcoin’s price was supported by persistent ETF inflows and its ability to decouple from broader market pressures. Latest technical signals highlight a shift toward prevailing downside risk, making a sustained break below $81,496 an important trigger for renewed caution in the coming sessions.










-
 Afghanistan
-
 Albania
-
 Algeria
-
 Angola
-
 Argentina
-
 Armenia
-
 Australia
-
 Austria
-
 Azerbaijan
-
 Bahamas
-
 Bahrain
-
 Bangladesh
-
 Belarus
-
 Belgium
-
 Bolivia
-
 Botswana
-
 Brazil
-
 Brunei
-
 Bulgaria
-
 Cambodia
-
 Cameroon
-
 Canada
-
 Chile
-
 China
-
 Colombia
-
 Congo
-
 Costa Rica
-
 Cote d'Ivoire
-
 Croatia
-
 Cuba
-
 Cyprus
-
 Czechia
-
 DR Congo
-
 Denmark
-
 Dominican Republic
-
 Ecuador
-
 Egypt
-
 El Salvador
-
 Estonia
-
 Eswatini
-
 Ethiopia
-
 Finland
-
 France
-
 Georgia
-
 Germany
-
 Ghana
-
 Greece
-
 Haiti
-
 Hong Kong
-
 Hungary
-
 India
-
 Indonesia
-
 Iran, Islamic republic
-
 Iraq
-
 Ireland
-
 Israel
-
 Italy
-
 Jamaica
-
 Japan
-
 Jordan
-
 Kazakhstan
-
 Kenya
-
 Korea
-
 Kuwait
-
 Kyrgyzstan
-
 Laos
-
 Latvia
-
 Lebanon
-
 Lesotho
-
 Libya
-
 Lithuania
-
 Luxembourg
-
 Madagascar
-
 Malaysia
-
 Malta
-
 Mauritius
-
 Mexico
-
 Moldova
-
 Mongolia
-
 Montenegro
-
 Morocco
-
 Mozambique
-
 Myanmar
-
 Namibia
-
 Nepal
-
 Netherlands
-
 New Zealand
-
 Nigeria
-
 North Macedonia
-
 Norway
-
 Oman
-
 Pakistan
-
 Palestine
-
 Panama
-
 Papua New Guinea
-
 Paraguay
-
 Peru
-
 Philippines
-
 Poland
-
 Portugal
-
 Puerto Rico
-
 Qatar
-
 Reunion
-
 Romania
-
 Rwanda
-
 Saudi Arabia
-
 Serbia
-
 Singapore
-
 Slovakia
-
 Slovenia
-
 Somalia
-
 South Africa
-
 Spain
-
 Sri Lanka
-
 Sweden
-
 Switzerland
-
 Syria
-
 Taiwan
-
 Tajikistan
-
 Tanzania
-
 Thailand
-
 Trinidad and Tobago
-
 Tunisia
-
 Turkey
-
 UAE
-
 Uganda
-
 Ukraine
-
 United Kingdom
-
United States
-
 Uruguay
-
 Uzbekistan
-
 Venezuela
-
 Vietnam
-
 Yemen
-
 Zambia
-
 Zimbabwe
- Forex
- Crypto












