


Shiba Inu (SHIB) is trading at $0.0000057, down 7.46% for the day. It currently sits below its key moving averages.
 0.0552
0.05556
0.0552
0.05556
Highlights
- Centralized exchanges received an inflow of 191 billion SHIB tokens, raising their holdings to $533.2 million in supply.
- Elevated SHIB liquidity on exchanges increases immediate market supply and adds risk of intensified sell-side pressure.
- SHIB/USD trades below key short-term averages with momentum indicators favoring sellers and a projected range of $0.00000545 to $0.00000598 over the next several days.
Sell-side risk rises as exchange supply surges after SHIB inflows
A sizable inflow of approximately 191 billion SHIB tokens into centralized exchanges has been reported, pushing total reserves on these platforms to nearly $533.2 million, according to Coin Turk on September 23, 2026. This elevated exchange balance increases immediate market supply and raises the likelihood of greater sell-side pressure, which can challenge the sustainability of recent rallies. The current news backdrop highlights concerns about heightened liquidity on exchanges, though price action has remained under broader selling pressure.
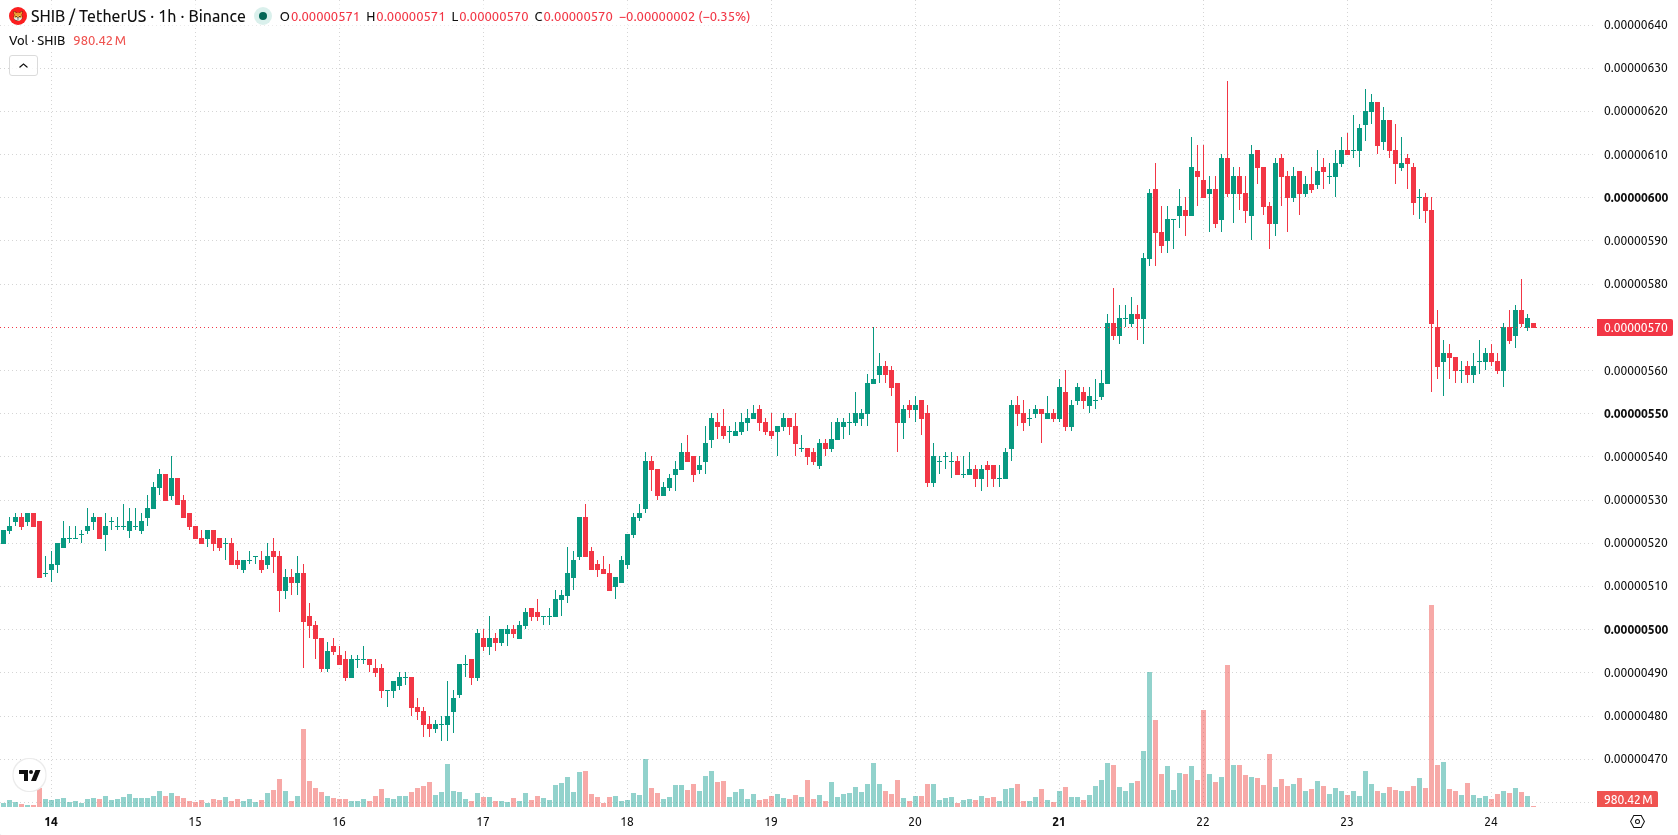
Bearish momentum persists as mixed technical signals drive uncertainty
On the hourly chart, SHIB/USD is trading just below both the MA-20 at $0.00000572 and the MA-50 at $0.00000593. However, on the daily timeframe, the price remains above the longer-term MA-200 at $0.0000053. The Ichimoku Kijun indicates immediate resistance at $0.00000589. MACD signals strong sell momentum, and ADX confirms ongoing selling pressure. RSI is neutral-to-bullish at 51.7, while Stoch RSI points to overbought conditions. CCI is neutral, Bull/Bear Power shows buyer dominance for intraday action, and the Awesome Oscillator is neutral, offering no confirmation of the prevailing trend. Conflicting momentum and oscillator signals reflect significant short-term uncertainty, with intraday buyers attempting to offset the broader bearish bias.
Consolidation likely as downside risks outweigh bullish probability
Over the next two to three trading days, SHIB/USD is expected to fluctuate between $0.00000545 and $0.00000598. There is a 43% probability of an upward move, but downside risk remains more likely given current technical signals and news context. The baseline scenario calls for consolidation within this typical volatility band, while a sustained move above the Ichimoku Kijun and upper range would enable renewed gains. Conversely, if support fails, a further decline toward the lower boundary could materialize.
Earlier, analysts noted that Shiba Inu faced persistent downside risk amid increased exchange inflows and subdued network activity. The current technical setup reinforces these cautionary signals, and traders should closely monitor the interplay between immediate support and resistance levels as short-term momentum remains conflicted.











-
 Afghanistan
-
 Albania
-
 Algeria
-
 Angola
-
 Argentina
-
 Armenia
-
 Australia
-
 Austria
-
 Azerbaijan
-
 Bahamas
-
 Bahrain
-
 Bangladesh
-
 Belarus
-
 Belgium
-
 Bolivia
-
 Botswana
-
 Brazil
-
 Brunei
-
 Bulgaria
-
 Cambodia
-
 Cameroon
-
 Canada
-
 Chile
Chile
-
 China
China
-
 Colombia
-
 Congo
Congo
-
 Costa Rica
-
 Cote d'Ivoire
-
 Croatia
-
 Cuba
Cuba
-
 Cyprus
-
 Czechia
-
 DR Congo
-
 Denmark
-
 Dominican Republic
-
 Ecuador
-
 Egypt
Egypt
-
 El Salvador
-
 Estonia
-
 Eswatini
-
 Ethiopia
-
 Finland
-
 France
-
 Georgia
-
 Germany
-
 Ghana
Ghana
-
 Greece
-
 Haiti
Haiti
-
 Hong Kong
-
 Hungary
-
 India
India
-
 Indonesia
-
 Iran, Islamic republic
-
 Iraq
Iraq
-
 Ireland
-
 Israel
-
 Italy
Italy
-
 Jamaica
-
 Japan
Japan
-
 Jordan
-
 Kazakhstan
-
 Kenya
Kenya
-
 Korea
Korea
-
 Kuwait
-
 Kyrgyzstan
-
 Laos
Laos
-
 Latvia
-
 Lebanon
-
 Lesotho
-
 Libya
Libya
-
 Lithuania
-
 Luxembourg
-
 Madagascar
-
 Malaysia
-
 Malta
Malta
-
 Mauritius
-
 Mexico
-
 Moldova
-
 Mongolia
-
 Montenegro
-
 Morocco
-
 Mozambique
-
 Myanmar
-
 Namibia
-
 Nepal
Nepal
-
 Netherlands
-
 New Zealand
-
 Nigeria
-
 North Macedonia
-
 Norway
-
 Oman
Oman
-
 Pakistan
-
 Palestine
-
 Panama
-
 Papua New Guinea
-
 Paraguay
-
 Peru
Peru
-
 Philippines
-
 Poland
-
 Portugal
-
 Puerto Rico
-
 Qatar
Qatar
-
 Reunion
-
 Romania
-
 Rwanda
-
 Saudi Arabia
-
 Serbia
-
 Singapore
-
 Slovakia
-
 Slovenia
-
 Somalia
-
 South Africa
-
 Spain
Spain
-
 Sri Lanka
-
 Sweden
-
 Switzerland
-
 Syria
Syria
-
 Taiwan
-
 Tajikistan
-
 Tanzania
-
 Thailand
-
 Trinidad and Tobago
-
 Tunisia
-
 Turkey
-
 UAE
UAE
-
 Uganda
-
 Ukraine
-
 United Kingdom
-
United States
-
 Uruguay
-
 Uzbekistan
-
 Venezuela
-
 Vietnam
-
 Yemen
Yemen
-
 Zambia
-
 Zimbabwe
- Forex
- Crypto












