

Sandbox falls over 10% as technical selling pressure and downside gap drive session lower

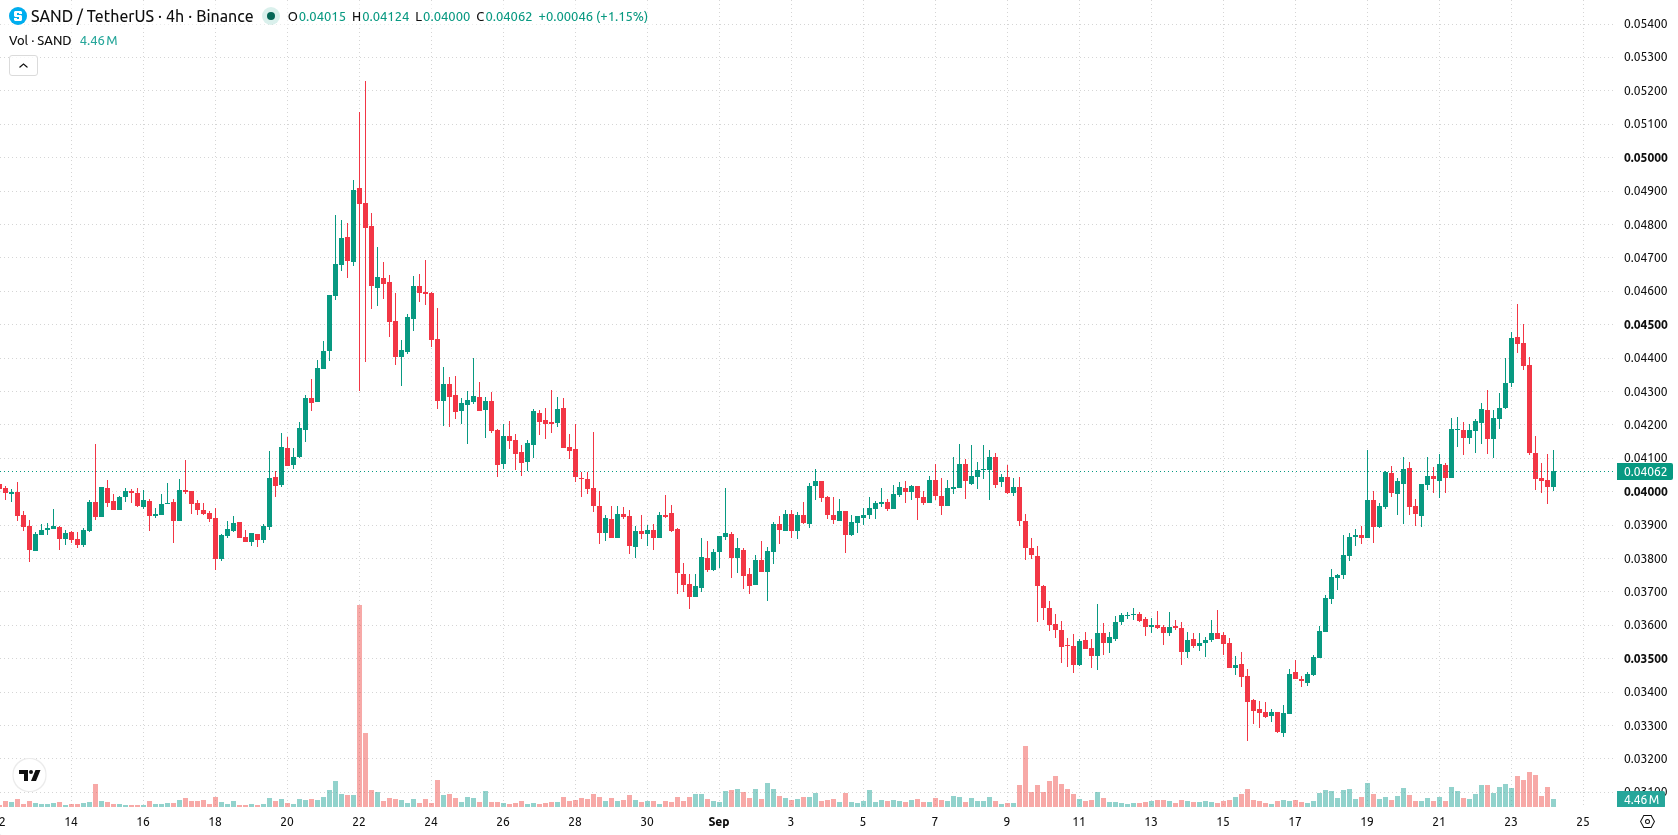
Sandbox (SAND) tumbled 10.36% as technical selling pressure and a downside gap dominated the session. The drop is reinforced by lingering long-term bearish signals, with the pair remaining under its 200-day moving average.
 0.0363
0.0421
Highlights
- SAND/USD trades above the 20-day and 50-day moving averages but remains below the 200-day, indicating sustained long-term pressure.
- Oscillator signals conflict, with the RSI showing a buy, the CCI in overbought, and Stochastic RSI flagging strong sell conditions.
- Expected five-day range is $0.0362 to $0.0483, with a 61% probability of a downward move and a range-bound baseline scenario.
Conflicting short-term momentum amid long-term downtrend
SAND/USD is trading above its 20-day and 50-day moving averages at $0.0382 and $0.0398, reflecting short- and medium-term bullish momentum. However, it remains below the long-term 200-day average of $0.0588, indicating persistent downward trend pressure. The nearest resistance is at $0.0411, and immediate support is at $0.0398, with the Ichimoku Kijun line at $0.0391 providing added support below. Momentum indicators paint a mixed picture: the MACD and ADX are neutral, the RSI points to a buy, the CCI is overbought, and the Stochastic RSI signals strong sell. Bull/Bear Power (BBP) remains positive at 0.0063, highlighting intraday buyer strength. The pair is trading near its intraday high after an opening gap down, and volatility amplitude is 3.79%. Conflicting momentum and oscillator signals contribute to a cautious tone intraday with pressure following the open.
Previously it was reported that Animoca Brands paused its planned Nasdaq reverse merger, highlighting continued uncertainties for digital asset companies seeking U.S. market access. With SAND/USD now facing conflicting technical signals and heightened volatility, traders should monitor for a decisive break above resistance or a drop below support to gauge the next directional move.









-
 Afghanistan
-
 Albania
-
 Algeria
-
 Angola
-
 Argentina
-
 Armenia
-
 Australia
-
 Austria
-
 Azerbaijan
-
 Bahamas
-
 Bahrain
-
 Bangladesh
-
 Belarus
-
 Belgium
-
 Bolivia
-
 Botswana
-
 Brazil
-
 Brunei
-
 Bulgaria
-
 Cambodia
-
 Cameroon
-
 Canada
-
 Chile
-
 China
-
 Colombia
-
 Congo
-
 Costa Rica
-
 Cote d'Ivoire
-
 Croatia
-
 Cuba
-
 Cyprus
-
 Czechia
-
 DR Congo
-
 Denmark
-
 Dominican Republic
-
 Ecuador
-
 Egypt
-
 El Salvador
-
 Estonia
-
 Eswatini
-
 Ethiopia
-
 Finland
-
 France
-
 Georgia
-
 Germany
-
 Ghana
-
 Greece
-
 Haiti
-
 Hong Kong
-
 Hungary
-
 India
-
 Indonesia
-
 Iran, Islamic republic
-
 Iraq
-
 Ireland
-
 Israel
-
 Italy
-
 Jamaica
-
 Japan
-
 Jordan
-
 Kazakhstan
-
 Kenya
-
 Korea
-
 Kuwait
-
 Kyrgyzstan
-
 Laos
-
 Latvia
-
 Lebanon
-
 Lesotho
-
 Libya
-
 Lithuania
-
 Luxembourg
-
 Madagascar
-
 Malaysia
-
 Malta
-
 Mauritius
-
 Mexico
-
 Moldova
-
 Mongolia
-
 Montenegro
-
 Morocco
-
 Mozambique
-
 Myanmar
-
 Namibia
-
 Nepal
-
 Netherlands
-
 New Zealand
-
 Nigeria
-
 North Macedonia
-
 Norway
-
 Oman
-
 Pakistan
-
 Palestine
-
 Panama
-
 Papua New Guinea
-
 Paraguay
-
 Peru
-
 Philippines
-
 Poland
-
 Portugal
-
 Puerto Rico
-
 Qatar
-
 Reunion
-
 Romania
-
 Rwanda
-
 Saudi Arabia
-
 Serbia
-
 Singapore
-
 Slovakia
-
 Slovenia
-
 Somalia
-
 South Africa
-
 Spain
-
 Sri Lanka
-
 Sweden
-
 Switzerland
-
 Syria
-
 Taiwan
-
 Tajikistan
-
 Tanzania
-
 Thailand
-
 Trinidad and Tobago
-
 Tunisia
-
 Turkey
-
 UAE
-
 Uganda
-
 Ukraine
-
 United Kingdom
-
United States
-
 Uruguay
-
 Uzbekistan
-
 Venezuela
-
 Vietnam
-
 Yemen
-
 Zambia
-
 Zimbabwe
- Forex
- Crypto












