

Support test ahead: Can Rocket Pool avoid deeper losses?

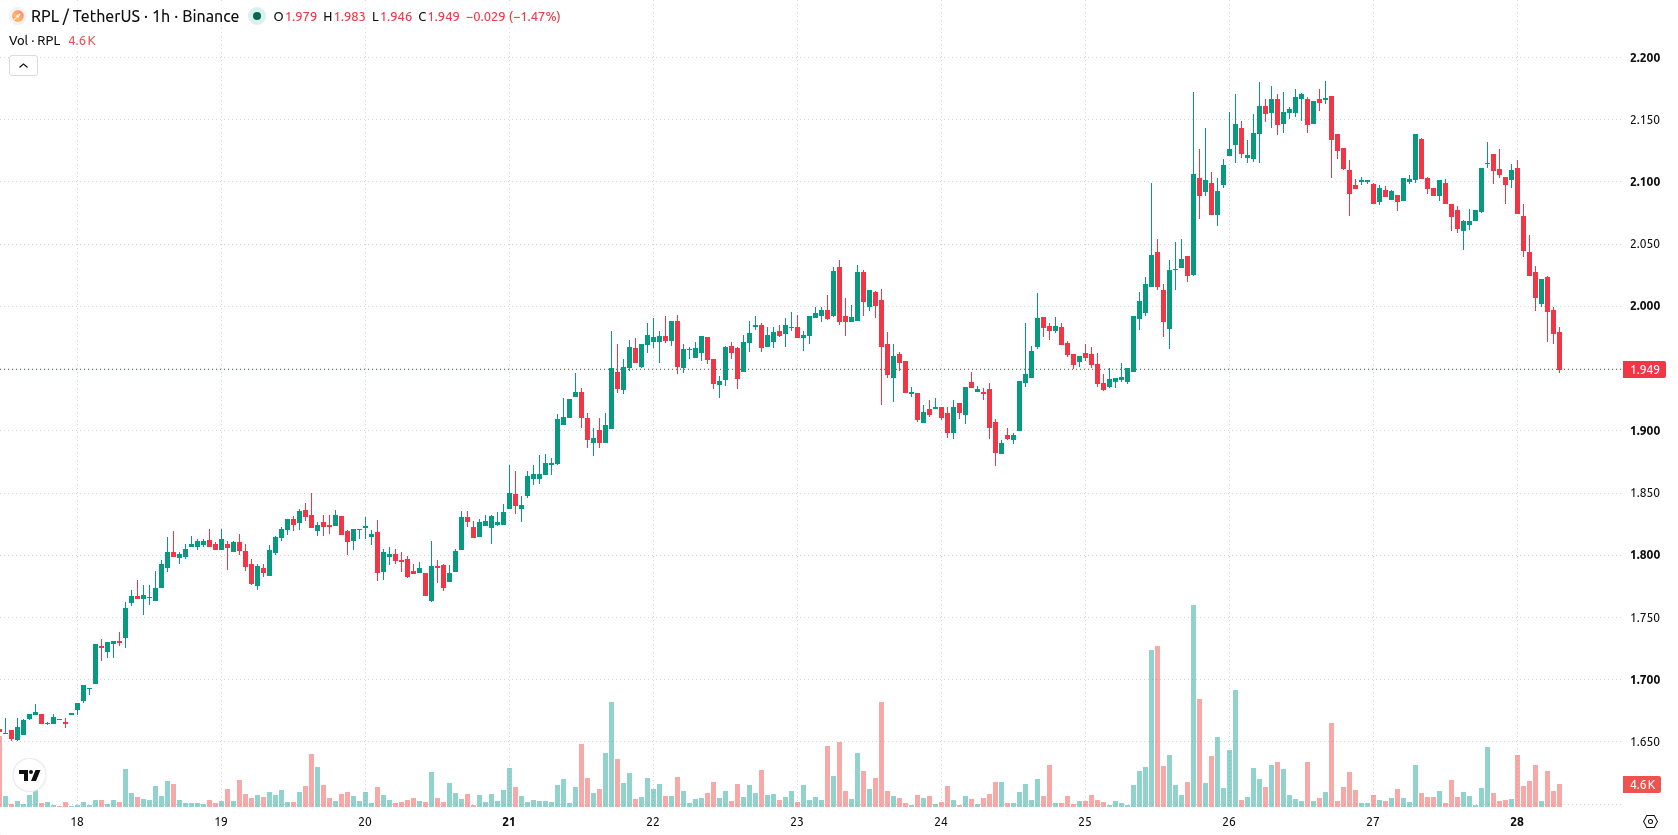
Rocket Pool (RPL) is trading at $1.95, down 7.12% for the session. The asset sits below its key short- and medium-term moving averages, while still holding above longer-term trend indicators.
 1.503
1.5410
Highlights
- RPL/USD trades below key short- and medium-term moving averages but remains supported above its long-term average.
- Bearish momentum dominates with price dropping 7.12% and most momentum and oscillator indicators aligning with intraday weakness.
- RPL/USD is projected to consolidate between $1.8867 and $2.098 over the next 2 to 3 days, with a 74% probability of further decline.
Bearish momentum persists as oscillators signal oversold stretch
On the technical side, RPL trades below the MA-20 and MA-50 on the working timeframe, while remaining above the MA-200 on the daily chart. Immediate resistance is marked by the Ichimoku Kijun at $2.0545. Both MACD and Awesome Oscillator are in sell territory, confirming bearish momentum, while ADX reads neutral, pointing to indecisive trend strength. RSI, Stoch RSI, and CCI are all flashing oversold conditions, suggesting that downside momentum is stretched. Intraday, Bull/Bear Power signals seller dominance, with today's price closing near session lows and a small positive opening gap of 0.005. Momentum and oscillators predominantly reinforce the intraday weakness, though oversold readings highlight potential for sharp corrective rebounds.
Further downside likely as rebound odds remain subdued
In the short term (next 2–3 trading days), RPL/USD is expected to trade within a volatility band between $1.8867 and $2.098. The forecast assigns a 26% probability to a rebound and a 74% chance of continued decline, making further downside moves more likely for now. Baseline expectations call for a consolidation within this range. Should the price climb and hold above $2.0545, a recovery scenario opens up, while a break below $1.8867 would validate ongoing downside momentum.
Earlier, analysts noted that Rocket Pool was maintaining a broadly bullish technical outlook, with an emphasis on monitoring pivotal support and resistance levels for potential breakouts or reversals. The current analysis signals a notable shift to bearish momentum, suggesting traders watch for a potential breakdown below $1.8867 or signs of a sharp corrective rebound should deeply oversold conditions trigger short-term recovery.











-
 Afghanistan
-
 Albania
-
 Algeria
-
 Angola
-
 Argentina
-
 Armenia
-
 Australia
-
 Austria
-
 Azerbaijan
-
 Bahamas
-
 Bahrain
-
 Bangladesh
-
 Belarus
-
 Belgium
-
 Bolivia
-
 Botswana
-
 Brazil
-
 Brunei
-
 Bulgaria
-
 Cambodia
-
 Cameroon
-
 Canada
-
 Chile
-
 China
-
 Colombia
-
 Congo
-
 Costa Rica
-
 Cote d'Ivoire
-
 Croatia
-
 Cuba
-
 Cyprus
-
 Czechia
-
 DR Congo
-
 Denmark
-
 Dominican Republic
-
 Ecuador
-
 Egypt
-
 El Salvador
-
 Estonia
-
 Eswatini
-
 Ethiopia
-
 Finland
-
 France
-
 Georgia
-
 Germany
-
 Ghana
-
 Greece
-
 Haiti
-
 Hong Kong
-
 Hungary
-
 India
-
 Indonesia
-
 Iran, Islamic republic
-
 Iraq
-
 Ireland
-
 Israel
-
 Italy
-
 Jamaica
-
 Japan
-
 Jordan
-
 Kazakhstan
-
 Kenya
-
 Korea
-
 Kuwait
-
 Kyrgyzstan
-
 Laos
-
 Latvia
-
 Lebanon
-
 Lesotho
-
 Libya
-
 Lithuania
-
 Luxembourg
-
 Madagascar
-
 Malaysia
-
 Malta
-
 Mauritius
-
 Mexico
-
 Moldova
-
 Mongolia
-
 Montenegro
-
 Morocco
-
 Mozambique
-
 Myanmar
-
 Namibia
-
 Nepal
-
 Netherlands
-
 New Zealand
-
 Nigeria
-
 North Macedonia
-
 Norway
-
 Oman
-
 Pakistan
-
 Palestine
-
 Panama
-
 Papua New Guinea
-
 Paraguay
-
 Peru
-
 Philippines
-
 Poland
-
 Portugal
-
 Puerto Rico
-
 Qatar
-
 Reunion
-
 Romania
-
 Rwanda
-
 Saudi Arabia
-
 Serbia
-
 Singapore
-
 Slovakia
-
 Slovenia
-
 Somalia
-
 South Africa
-
 Spain
-
 Sri Lanka
-
 Sweden
-
 Switzerland
-
 Syria
-
 Taiwan
-
 Tajikistan
-
 Tanzania
-
 Thailand
-
 Trinidad and Tobago
-
 Tunisia
-
 Turkey
-
 UAE
-
 Uganda
-
 Ukraine
-
 United Kingdom
-
United States
-
 Uruguay
-
 Uzbekistan
-
 Venezuela
-
 Vietnam
-
 Yemen
-
 Zambia
-
 Zimbabwe
- Forex
- Crypto












