


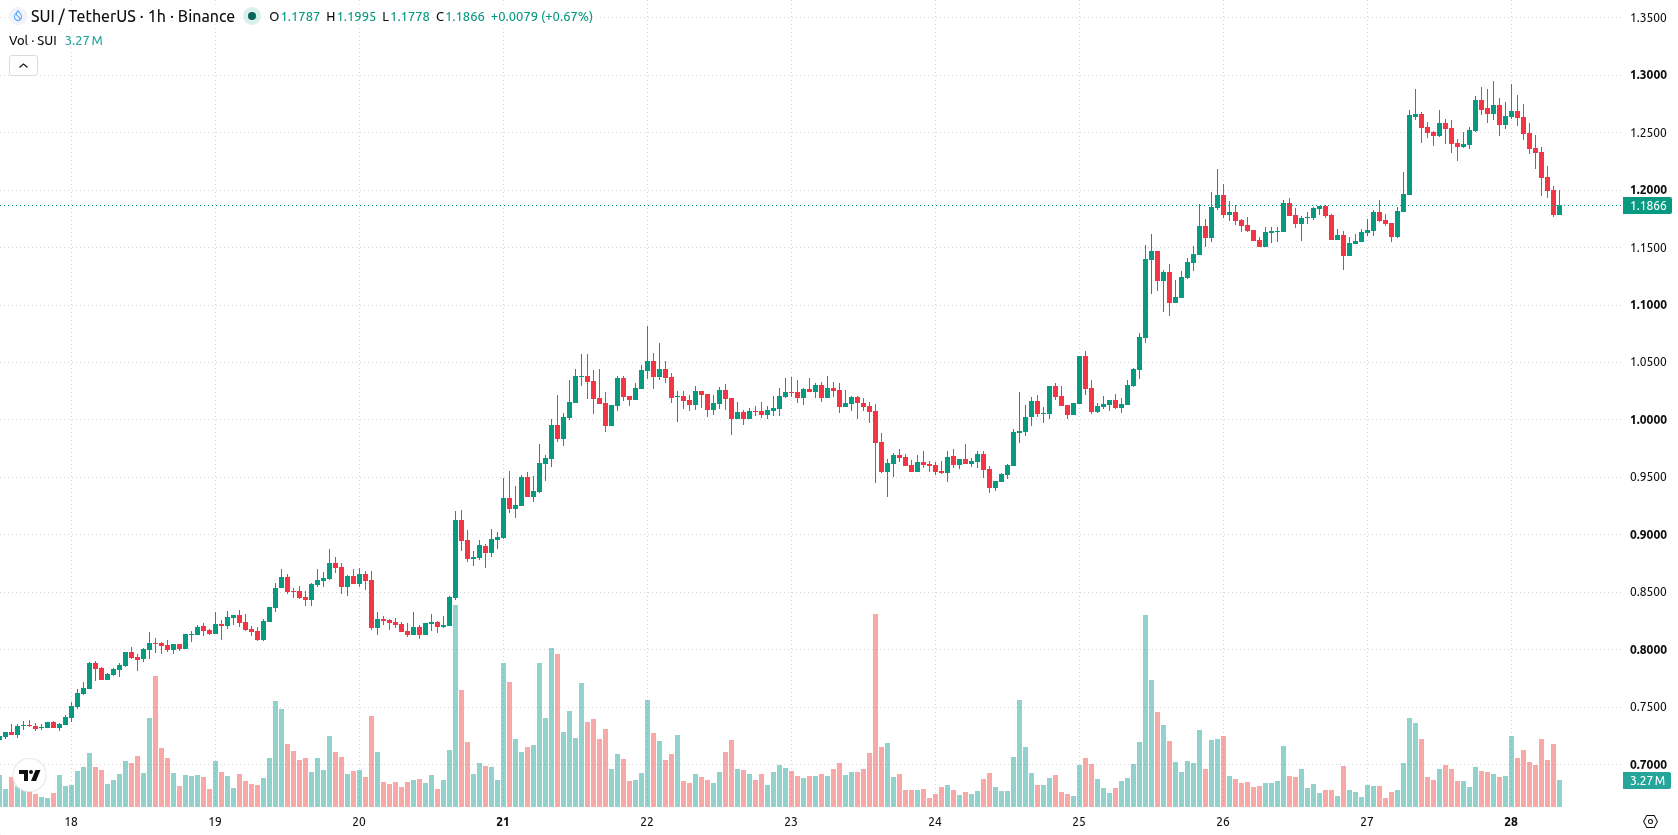
Sui (SUI) is trading at $1.1865, down 7.16% on the day. The asset currently sits below its short- and medium-term moving averages, while maintaining position above its long-term trend indicator.
 0.9013
0.9620
Highlights
- SUI trades below short- and medium-term moving averages, confirming sustained downward price action in the near term.
- Momentum indicators are deeply negative with multiple oversold readings, showing sellers remain in control despite short-term exhaustion signals.
- Price dropped 7.16% to $1.1865 and is expected to consolidate in the $1.1055 to $1.2705 range over the next two to three days.
Seller dominance as multiple technical indicators weaken
On the technical front, SUI is positioned below the MA-20 at $1.2471 and MA-50 at $1.2092, reflecting pronounced short- and medium-term pressure from sellers, while remaining supported by the MA-200 at $0.8464. The Ichimoku Kijun is set at $1.2377, acting as immediate resistance. Momentum signals are notably negative: RSI is at 35.87, ADX also points to a Sell, while MACD is Neutral. Both CCI and Stoch RSI are in oversold territory, indicating short-term exhaustion, and Bull/Bear Power confirms sellers' dominance. The Awesome Oscillator (AO) reinforces strong sell-side momentum, contributing to the observed weakness in the current price action.
Directional risk balances consolidation with breakout potential
In the next 2–3 trading days, the expected price range for SUI is $1.1055 to $1.2705. There is a 61% probability of continued downward movement, and a 39% chance of a short-term rebound. The baseline scenario anticipates a period of consolidation within this volatility corridor. A breakout above the $1.2377 resistance could spur a move toward the upper end of the range, while a drop below $1.1055 would open the door for further declines.
Earlier, analysts noted that Sui's persistent bullish momentum was driven by strong network growth and elevated trading volumes. The current shift to pronounced short-term selling pressure and oversold technical signals marks a notable change in trend, making the $1.2377 resistance level a critical threshold for potential price recovery in the coming days.










-
 Afghanistan
-
 Albania
-
 Algeria
-
 Angola
-
 Argentina
-
 Armenia
-
 Australia
-
 Austria
-
 Azerbaijan
-
 Bahamas
-
 Bahrain
-
 Bangladesh
-
 Belarus
-
 Belgium
-
 Bolivia
-
 Botswana
-
 Brazil
-
 Brunei
-
 Bulgaria
-
 Cambodia
-
 Cameroon
-
 Canada
-
 Chile
-
 China
-
 Colombia
-
 Congo
-
 Costa Rica
-
 Cote d'Ivoire
-
 Croatia
-
 Cuba
-
 Cyprus
-
 Czechia
-
 DR Congo
-
 Denmark
-
 Dominican Republic
-
 Ecuador
-
 Egypt
-
 El Salvador
-
 Estonia
-
 Eswatini
-
 Ethiopia
-
 Finland
-
 France
-
 Georgia
-
 Germany
-
 Ghana
-
 Greece
-
 Haiti
-
 Hong Kong
-
 Hungary
-
 India
-
 Indonesia
-
 Iran, Islamic republic
-
 Iraq
-
 Ireland
-
 Israel
-
 Italy
-
 Jamaica
-
 Japan
-
 Jordan
-
 Kazakhstan
-
 Kenya
-
 Korea
-
 Kuwait
-
 Kyrgyzstan
-
 Laos
-
 Latvia
-
 Lebanon
-
 Lesotho
-
 Libya
-
 Lithuania
-
 Luxembourg
-
 Madagascar
-
 Malaysia
-
 Malta
-
 Mauritius
-
 Mexico
-
 Moldova
-
 Mongolia
-
 Montenegro
-
 Morocco
-
 Mozambique
-
 Myanmar
-
 Namibia
-
 Nepal
-
 Netherlands
-
 New Zealand
-
 Nigeria
-
 North Macedonia
-
 Norway
-
 Oman
-
 Pakistan
-
 Palestine
-
 Panama
-
 Papua New Guinea
-
 Paraguay
-
 Peru
-
 Philippines
-
 Poland
-
 Portugal
-
 Puerto Rico
-
 Qatar
-
 Reunion
-
 Romania
-
 Rwanda
-
 Saudi Arabia
-
 Serbia
-
 Singapore
-
 Slovakia
-
 Slovenia
-
 Somalia
-
 South Africa
-
 Spain
-
 Sri Lanka
-
 Sweden
-
 Switzerland
-
 Syria
-
 Taiwan
-
 Tajikistan
-
 Tanzania
-
 Thailand
-
 Trinidad and Tobago
-
 Tunisia
-
 Turkey
-
 UAE
-
 Uganda
-
 Ukraine
-
 United Kingdom
-
United States
-
 Uruguay
-
 Uzbekistan
-
 Venezuela
-
 Vietnam
-
 Yemen
-
 Zambia
-
 Zimbabwe
- Forex
- Crypto












