

Maple slips below $0.2199 support as selling pressure persists

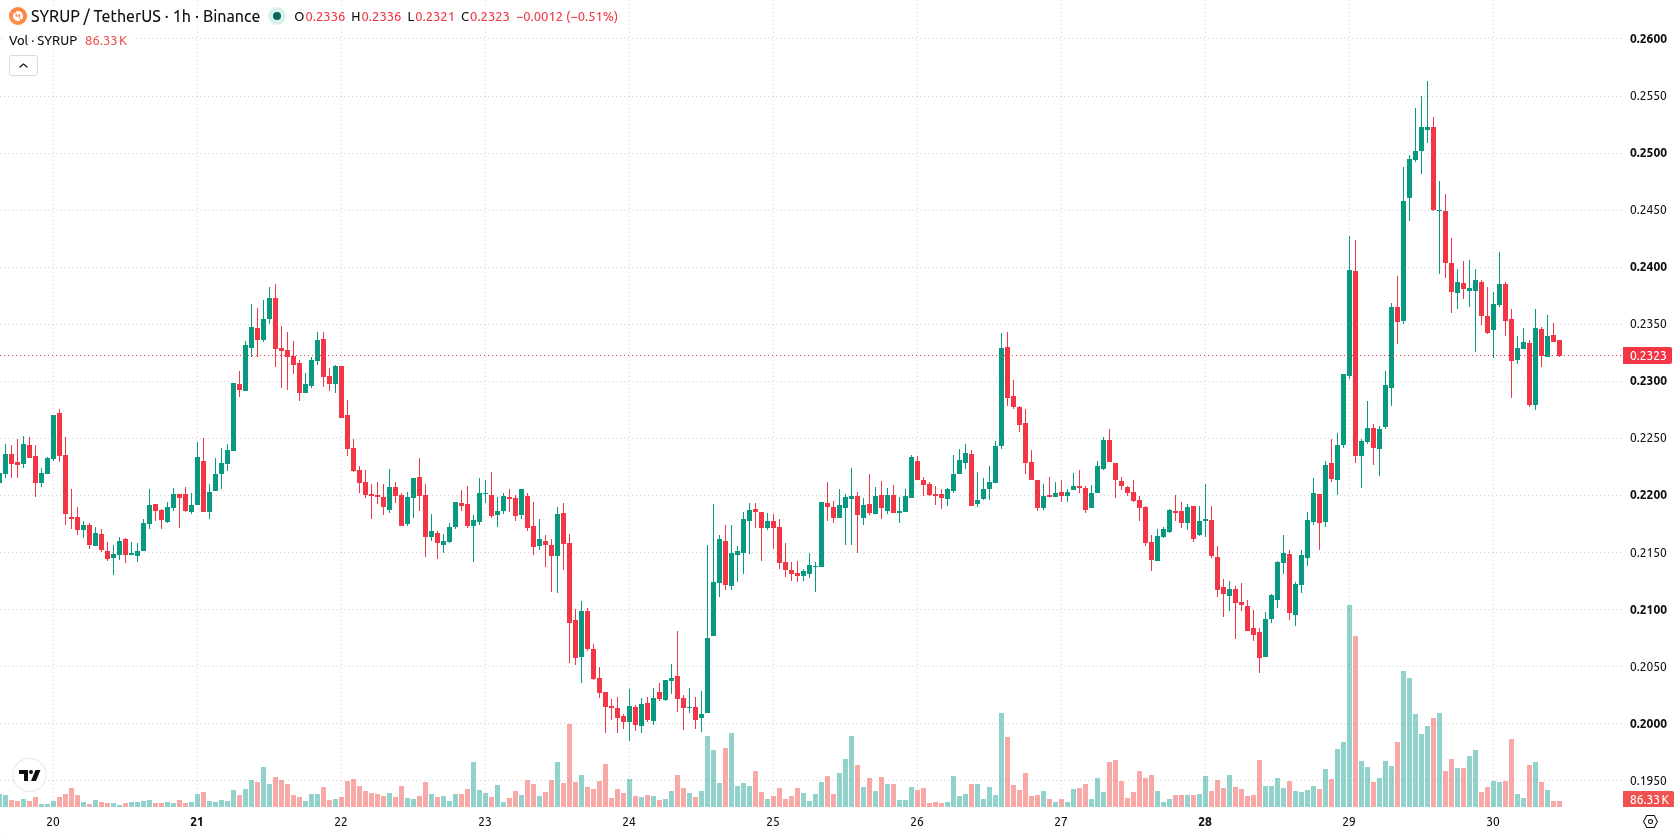
Maple (SYRUP) is trading at $0.2328, down 7.18% on the day. The move places the price below its key short-term average but still above medium- and long-term moving averages.
 0.1088
0.1386
Highlights
- SYRUP/USD is experiencing short-term selling pressure but holds above medium- and long-term trend supports.
- Momentum and oscillator indicators present mixed signals, with no clear overbought or oversold conditions for intraday trading.
- Price is projected to trade between $0.2199 and $0.2457 over the next few days, with a 75% probability of sideways or upward movement.
Mixed momentum signals as price holds mid-range amid indecision
The SYRUP/USD pair is currently positioned below the MA-20, but above both the MA-50 and MA-200, confirming short-term weakness within broader supportive trends. The Ichimoku Kijun level at $0.2419 serves as immediate resistance, while intraday volatility remains elevated. Momentum indicators are mixed: RSI signals a Sell bias, whereas MACD, ADX, Stochastic RSI, and CCI all remain Neutral. Bull/Bear Power supports the presence of buyers on an intraday basis, contrasting with the underlying selling pressure as price sits mid-range for the session, indicating market indecision.
Bullish probability rises as intraday volatility sets trading band
Over the next two to three trading days, Maple is likely to trade within the band of $0.2199 to $0.2457, representing the typical volatility region relative to current levels. The probability for an upward move is assessed at 75%, suggesting that a bullish scenario would require a decisive break above immediate resistance at $0.2419. A failure to hold above $0.2199 would activate a bearish scenario, while the base case anticipates continued sideways action within this corridor.
Previously it was reported that Maple benefited from expanded institutional appeal and cross-chain interoperability following significant protocol integrations. The current market setup adds a dimension of short-term vulnerability, making the $0.2419 resistance level a key indicator for any renewed upside momentum over the coming sessions.










-
 Afghanistan
-
 Albania
-
 Algeria
-
 Angola
-
 Argentina
-
 Armenia
-
 Australia
-
 Austria
-
 Azerbaijan
-
 Bahamas
-
 Bahrain
-
 Bangladesh
-
 Belarus
-
 Belgium
-
 Bolivia
-
 Botswana
-
 Brazil
-
 Brunei
-
 Bulgaria
-
 Cambodia
-
 Cameroon
-
 Canada
-
 Chile
-
 China
-
 Colombia
-
 Congo
-
 Costa Rica
-
 Cote d'Ivoire
-
 Croatia
-
 Cuba
-
 Cyprus
-
 Czechia
-
 DR Congo
-
 Denmark
-
 Dominican Republic
-
 Ecuador
-
 Egypt
-
 El Salvador
-
 Estonia
-
 Eswatini
-
 Ethiopia
-
 Finland
-
 France
-
 Georgia
-
 Germany
-
 Ghana
-
 Greece
-
 Haiti
-
 Hong Kong
-
 Hungary
-
 India
-
 Indonesia
-
 Iran, Islamic republic
-
 Iraq
-
 Ireland
-
 Israel
-
 Italy
-
 Jamaica
-
 Japan
-
 Jordan
-
 Kazakhstan
-
 Kenya
-
 Korea
-
 Kuwait
-
 Kyrgyzstan
-
 Laos
-
 Latvia
-
 Lebanon
-
 Lesotho
-
 Libya
-
 Lithuania
-
 Luxembourg
-
 Madagascar
-
 Malaysia
-
 Malta
-
 Mauritius
-
 Mexico
-
 Moldova
-
 Mongolia
-
 Montenegro
-
 Morocco
-
 Mozambique
-
 Myanmar
-
 Namibia
-
 Nepal
-
 Netherlands
-
 New Zealand
-
 Nigeria
-
 North Macedonia
-
 Norway
-
 Oman
-
 Pakistan
-
 Palestine
-
 Panama
-
 Papua New Guinea
-
 Paraguay
-
 Peru
-
 Philippines
-
 Poland
-
 Portugal
-
 Puerto Rico
-
 Qatar
-
 Reunion
-
 Romania
-
 Rwanda
-
 Saudi Arabia
-
 Serbia
-
 Singapore
-
 Slovakia
-
 Slovenia
-
 Somalia
-
 South Africa
-
 Spain
-
 Sri Lanka
-
 Sweden
-
 Switzerland
-
 Syria
-
 Taiwan
-
 Tajikistan
-
 Tanzania
-
 Thailand
-
 Trinidad and Tobago
-
 Tunisia
-
 Turkey
-
 UAE
-
 Uganda
-
 Ukraine
-
 United Kingdom
-
United States
-
 Uruguay
-
 Uzbekistan
-
 Venezuela
-
 Vietnam
-
 Yemen
-
 Zambia
-
 Zimbabwe
- Forex
- Crypto












