

TAO slides as sellers dominate and price gaps downward

Bittensor (TAO) is trading at $289.6 after a 7.39% decline today. The asset has moved below its key short- and medium-term moving averages, but remains above longer-term averages.
 238.6
262.40
Highlights
- Bittensor sustained a market capitalization of $3.52 billion on October 1, 2026, maintaining notable network scale and liquidity.
- Trading volume dropped below its monthly average on October 2, 2026, reducing immediate liquidity during the session.
- TAO/USD trades below short-term moving averages with strong sell signals from major indicators, projecting a very high probability of further downside in the $277.28 to $301.92 range.
Liquidity drop and capitalization growth reshape participation dynamics
Bittensor maintained a position above its key moving averages through the past 30 days, a technical backdrop that likely influenced broader market engagement and participation. The reported market capitalization of $3.52 billion as of October 1, 2026, reflects the growing scale and liquidity of the network. However, trading volume fell below its monthly average on October 2, 2026, which may have limited immediate liquidity and contributed to less orderly trading as today’s session unfolded.
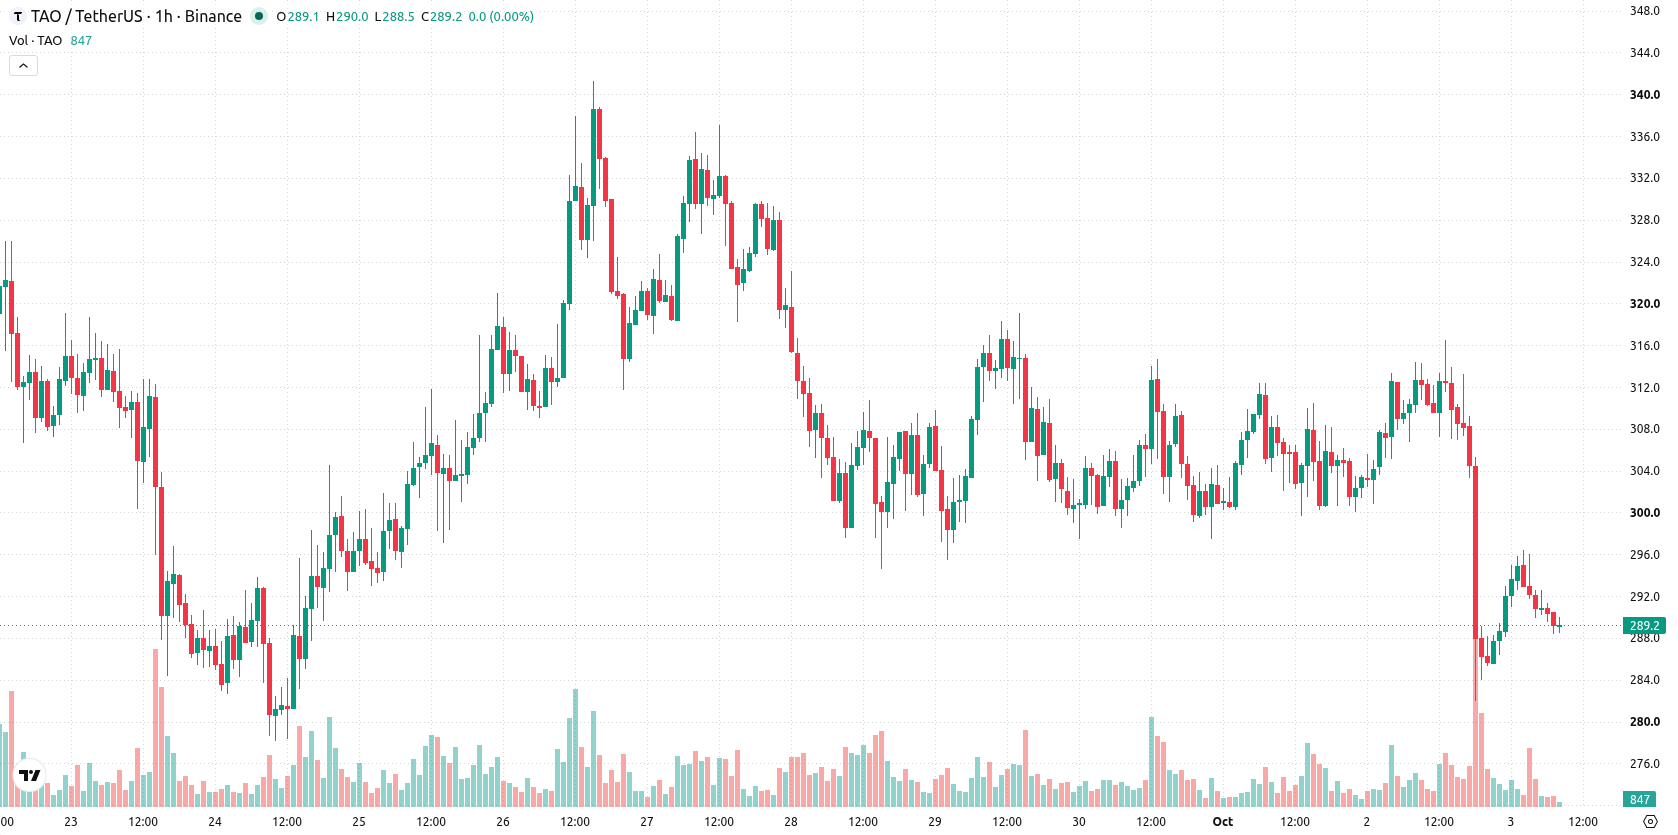
Bearish momentum prevails as support holds above long-term average
On the h1 chart, TAO/USD is trading below both the MA-20 at $296.02 and MA-50 at $302.41, while remaining above the MA-200 at $246.6. The Ichimoku Kijun sits at $299.25, serving as immediate resistance. Momentum indicators show MACD at Strong Sell and a Neutral ADX, with RSI at 35.14 (Sell), CCI also in Sell mode, and Stochastic RSI at Neutral. Bull/Bear Power is Oversold, pointing to seller dominance, while the Awesome Oscillator confirms today’s bearish momentum. The asset has experienced a significant gap down of $20.6 and is trading near session lows with moderate volatility.
Breakout prospects limited as volatility bands contain movement
Over the next two to three sessions, TAO/USD is likely to remain rangebound between $277.28 and $301.92, in line with typical volatility bands at current levels. The probability of an upward breakout is very low unless price can establish support above the $299.25 resistance. A move below the immediate support at $277.28 would indicate further bearish continuation, while price action within the stated range remains the baseline scenario.
Earlier, analysts noted that Bittensor was navigating mixed technical signals amid heightened volatility, with downside risks prevailing in the short term. The current analysis strengthens this view with further evidence of selling dominance and elevated bearish momentum, highlighting $277.28 as the key support level to watch for potential breakdown.










-
 Afghanistan
-
 Albania
-
 Algeria
-
 Angola
-
 Argentina
-
 Armenia
-
 Australia
-
 Austria
-
 Azerbaijan
-
 Bahamas
-
 Bahrain
-
 Bangladesh
-
 Belarus
-
 Belgium
-
 Bolivia
-
 Botswana
-
 Brazil
-
 Brunei
-
 Bulgaria
-
 Cambodia
-
 Cameroon
-
 Canada
-
 Chile
-
 China
-
 Colombia
-
 Congo
-
 Costa Rica
-
 Cote d'Ivoire
-
 Croatia
-
 Cuba
-
 Cyprus
-
 Czechia
-
 DR Congo
-
 Denmark
-
 Dominican Republic
-
 Ecuador
-
 Egypt
-
 El Salvador
-
 Estonia
-
 Eswatini
-
 Ethiopia
-
 Finland
-
 France
-
 Georgia
-
 Germany
-
 Ghana
-
 Greece
-
 Haiti
-
 Hong Kong
-
 Hungary
-
 India
-
 Indonesia
-
 Iran, Islamic republic
-
 Iraq
-
 Ireland
-
 Israel
-
 Italy
-
 Jamaica
-
 Japan
-
 Jordan
-
 Kazakhstan
-
 Kenya
-
 Korea
-
 Kuwait
-
 Kyrgyzstan
-
 Laos
-
 Latvia
-
 Lebanon
-
 Lesotho
-
 Libya
-
 Lithuania
-
 Luxembourg
-
 Madagascar
-
 Malaysia
-
 Malta
-
 Mauritius
-
 Mexico
-
 Moldova
-
 Mongolia
-
 Montenegro
-
 Morocco
-
 Mozambique
-
 Myanmar
-
 Namibia
-
 Nepal
-
 Netherlands
-
 New Zealand
-
 Nigeria
-
 North Macedonia
-
 Norway
-
 Oman
-
 Pakistan
-
 Palestine
-
 Panama
-
 Papua New Guinea
-
 Paraguay
-
 Peru
-
 Philippines
-
 Poland
-
 Portugal
-
 Puerto Rico
-
 Qatar
-
 Reunion
-
 Romania
-
 Rwanda
-
 Saudi Arabia
-
 Serbia
-
 Singapore
-
 Slovakia
-
 Slovenia
-
 Somalia
-
 South Africa
-
 Spain
-
 Sri Lanka
-
 Sweden
-
 Switzerland
-
 Syria
-
 Taiwan
-
 Tajikistan
-
 Tanzania
-
 Thailand
-
 Trinidad and Tobago
-
 Tunisia
-
 Turkey
-
 UAE
-
 Uganda
-
 Ukraine
-
 United Kingdom
-
United States
-
 Uruguay
-
 Uzbekistan
-
 Venezuela
-
 Vietnam
-
 Yemen
-
 Zambia
-
 Zimbabwe
- Forex
- Crypto












