

Overbought signals suggest stretched conditions: Can The Graph extend gains?

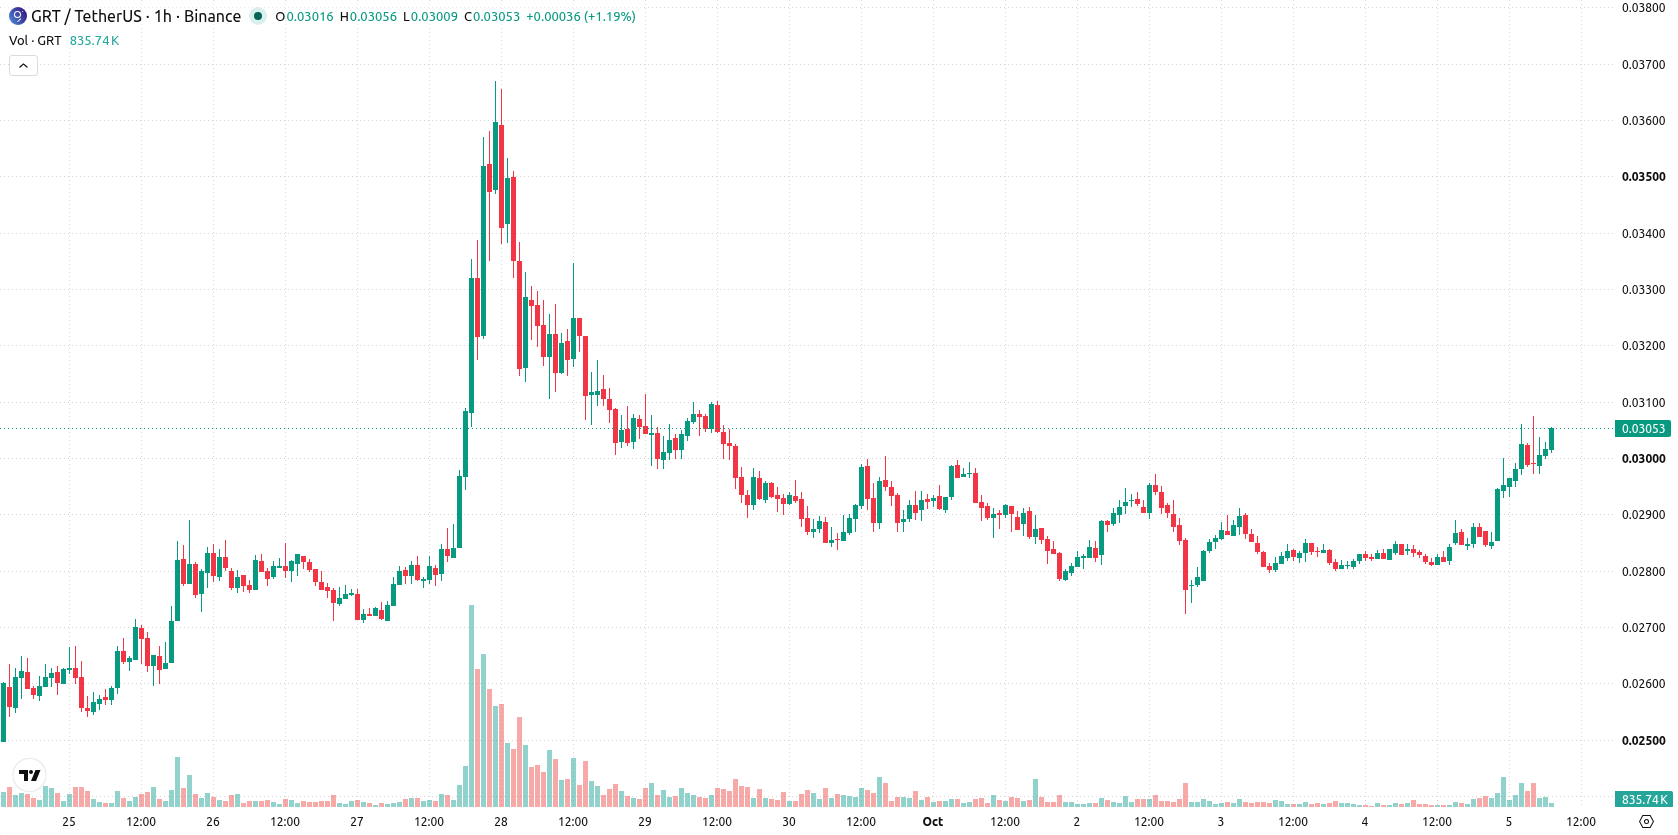
The Graph (GRT) is trading at $0.03053 after rising 7.5% today. The token remains above its key moving averages, reflecting strong momentum in the current session.
 0.02056
0.02314000
Highlights
- GRT/USD shows a bullish trend across short-, medium-, and long-term timeframes, trading above all major moving averages.
- Momentum indicators are strongly positive with buyers maintaining control and price action exhibiting aggressive upward movement, though short-term conditions are overbought.
- For the next 2 to 3 sessions, price is projected to range between $0.02467 and $0.03139983, with a very high chance of remaining within this corridor.
Overbought signals intensify as buyers drive intraday volatility
On the h1 chart, GRT/USD trades above both the MA-20 at $0.029087 and MA-50 at $0.028598. The daily chart shows price well above the MA-200 at $0.02112475. The Ichimoku Kijun sits at $0.02942, acting as immediate support for the current move. Short-term momentum indicators confirm underlying strength: MACD, ADX, Stoch RSI, Bull/Bear Power, and Awesome Oscillator all point to active buyer dominance. RSI is elevated at 72.69 and CCI is overbought, signaling increasingly stretched intraday trading conditions as price closes near the session high with notable volatility and a $0.00111 gap.
Upside scenario favored as breakout risk builds on range edge
Looking ahead to the next two to three sessions, GRT is expected to trade in a volatility corridor between $0.02467 and $0.03139983. The baseline scenario is for price to remain within this range, with the probability of an upside move rated very high and a downside break considered unlikely. A close above $0.03139983 would likely trigger further gains toward new local highs, while a drop below $0.02942 support could quickly accelerate declines toward the lower end of the expected range.
Earlier, analysts noted that The Graph had shifted from a bearish phase to a more constructive trend, anchored by sustained support and improving technical structure. Current price action reinforces this positive momentum, with upside risk prevailing as long as price holds above immediate support at $0.02942 in the coming sessions.






Latest GRT News



-
 Afghanistan
-
 Albania
-
 Algeria
-
 Angola
-
 Argentina
-
 Armenia
-
 Australia
-
 Austria
-
 Azerbaijan
-
 Bahamas
-
 Bahrain
-
 Bangladesh
-
 Belarus
-
 Belgium
-
 Bolivia
-
 Botswana
-
 Brazil
-
 Brunei
-
 Bulgaria
-
 Cambodia
-
 Cameroon
-
 Canada
-
 Chile
-
 China
-
 Colombia
-
 Congo
-
 Costa Rica
-
 Cote d'Ivoire
-
 Croatia
-
 Cuba
-
 Cyprus
-
 Czechia
-
 DR Congo
-
 Denmark
-
 Dominican Republic
-
 Ecuador
-
 Egypt
-
 El Salvador
-
 Estonia
-
 Eswatini
-
 Ethiopia
-
 Finland
-
 France
-
 Georgia
-
 Germany
-
 Ghana
-
 Greece
-
 Haiti
-
 Hong Kong
-
 Hungary
-
 India
-
 Indonesia
-
 Iran, Islamic republic
-
 Iraq
-
 Ireland
-
 Israel
-
 Italy
-
 Jamaica
-
 Japan
-
 Jordan
-
 Kazakhstan
-
 Kenya
-
 Korea
-
 Kuwait
-
 Kyrgyzstan
-
 Laos
-
 Latvia
-
 Lebanon
-
 Lesotho
-
 Libya
-
 Lithuania
-
 Luxembourg
-
 Madagascar
-
 Malaysia
-
 Malta
-
 Mauritius
-
 Mexico
-
 Moldova
-
 Mongolia
-
 Montenegro
-
 Morocco
-
 Mozambique
-
 Myanmar
-
 Namibia
-
 Nepal
-
 Netherlands
-
 New Zealand
-
 Nigeria
-
 North Macedonia
-
 Norway
-
 Oman
-
 Pakistan
-
 Palestine
-
 Panama
-
 Papua New Guinea
-
 Paraguay
-
 Peru
-
 Philippines
-
 Poland
-
 Portugal
-
 Puerto Rico
-
 Qatar
-
 Reunion
-
 Romania
-
 Rwanda
-
 Saudi Arabia
-
 Serbia
-
 Singapore
-
 Slovakia
-
 Slovenia
-
 Somalia
-
 South Africa
-
 Spain
-
 Sri Lanka
-
 Sweden
-
 Switzerland
-
 Syria
-
 Taiwan
-
 Tajikistan
-
 Tanzania
-
 Thailand
-
 Trinidad and Tobago
-
 Tunisia
-
 Turkey
-
 UAE
-
 Uganda
-
 Ukraine
-
 United Kingdom
-
United States
-
 Uruguay
-
 Uzbekistan
-
 Venezuela
-
 Vietnam
-
 Yemen
-
 Zambia
-
 Zimbabwe
- Forex
- Crypto












