

The Graph weekly forecast: Holds gains as buyers stay in control

The Graph (GRT) is holding near $0.028 as buyers maintained control this week, with the token gaining a little more than 3% following fresh interest. This weekly strength follows continued momentum from a recent product focus shift and increased network activity. Traders will be watching if the positive trend carries through the days ahead.
 0.02027
0.02314000
Highlights
- The Graph trades at $0.02843, up 3.16% in seven days, showing short-term strength above key moving averages.
- Technical indicators confirm strong trend momentum, but the Stochastic RSI is oversold, indicating mixed short-term dynamics.
- Expected range for the coming week is $0.02349831 to $0.03336168, with support at $0.02724 and resistance at $0.03656.
Network transition drives trading volume as strategic pivot lifts sentiment
The Graph announced a strategic pivot in Q3 2026, making its decentralized Graph Network the core product, according to posts from The Graph Foundation and confirmed by cryptonews.net. Developer and query activity is now transitioning from the Subgraph Studio to the main network, with Indexers able to earn rewards for direct query service. The Graph Foundation’s added role as an operator aims to smooth this transition and drive adoption, fueling heightened trading volumes and anticipation for further network upgrades into next week.
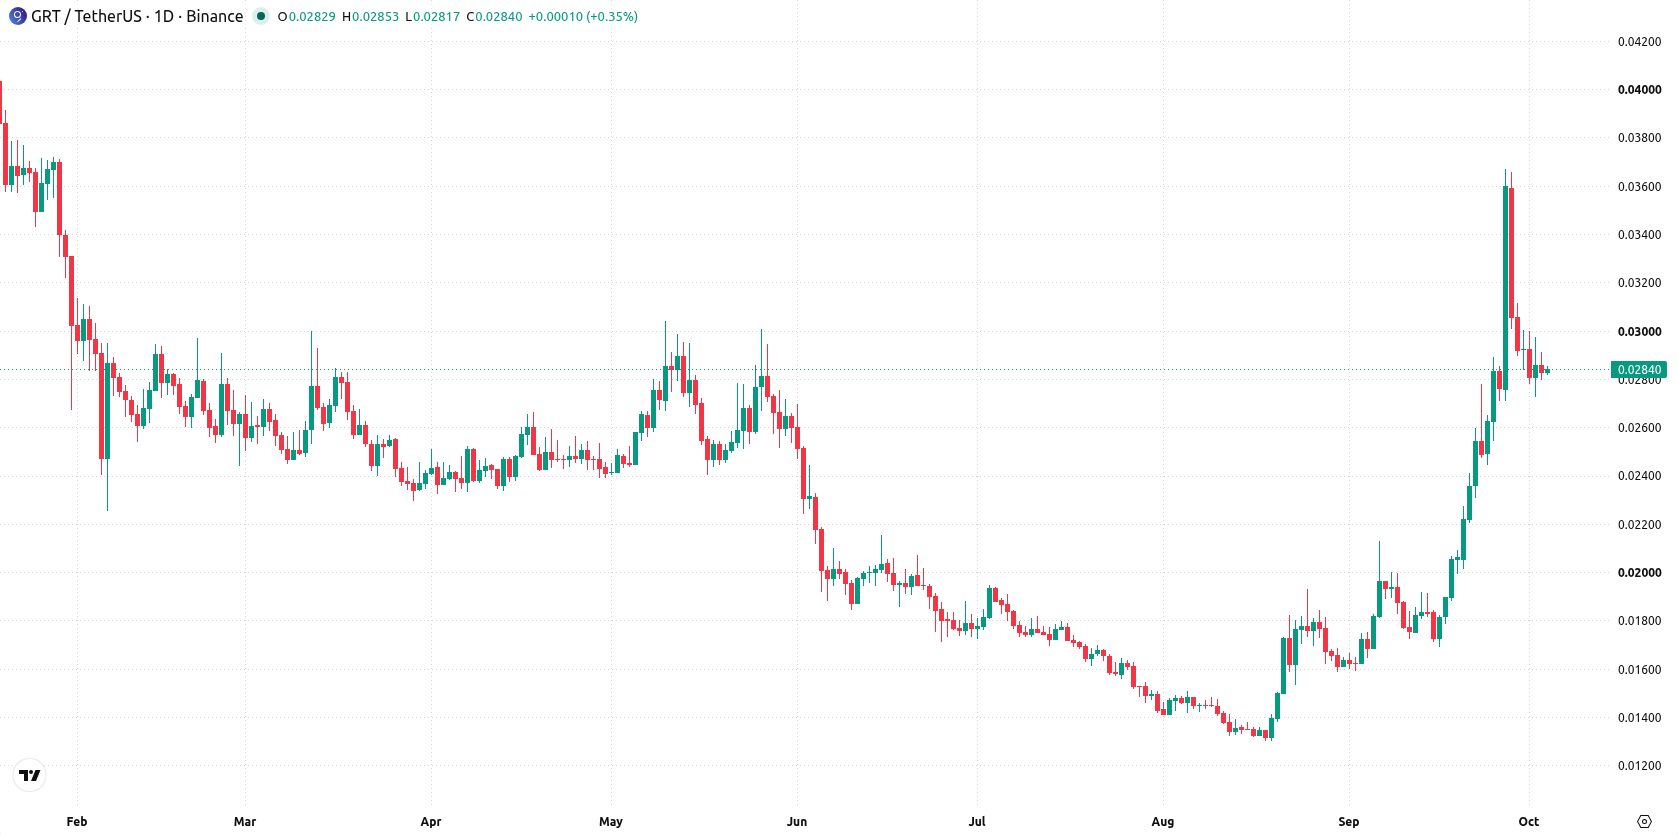
Bullish momentum persists as mixed indicators reveal overextended rally
The daily chart shows a trending structure supported by a sustained move higher with a firm trend, reinforced by strong volatility at 34.21%. The MACD is bullish with a reading of 0.00352235, and the ADX at 46.23759571 confirms strong trend momentum, while the Stochastic RSI sits in the oversold zone, which could temper immediate upside. Nearest support lies at $0.02724, also reinforced by the Ichimoku Kijun at $0.02681, while resistance is set at $0.03656. This setup favors further upward continuation, although the combination of bullish momentum and an oversold Stochastic RSI signals mixed short-term dynamics.
Bullish bias remains as breakouts hinge on key range boundaries next week
Over the coming week, the expected range for The Graph is $0.02349831 to $0.03336168, with a very high probability of an increase and a very low probability of a decrease. The base case is continued trending activity within this range, anchored by support near $0.02724. If price breaks above $0.03656, a bullish extension is likely, while a drop below $0.02724 would expose a deeper pullback toward the lower end of the forecast range.
Previously it was reported that The Graph had faced persistent bearish momentum as it remained under key moving averages despite structural protocol upgrades. The current article signals a shift in trend, with a sustained move higher now anchored by key support at $0.02724 and a prevailing scenario that favors continued upward continuation unless that support fails.










-
 Afghanistan
-
 Albania
-
 Algeria
-
 Angola
-
 Argentina
-
 Armenia
-
 Australia
-
 Austria
-
 Azerbaijan
-
 Bahamas
-
 Bahrain
-
 Bangladesh
-
 Belarus
-
 Belgium
-
 Bolivia
-
 Botswana
-
 Brazil
-
 Brunei
-
 Bulgaria
-
 Cambodia
-
 Cameroon
-
 Canada
-
 Chile
-
 China
-
 Colombia
-
 Congo
-
 Costa Rica
-
 Cote d'Ivoire
-
 Croatia
-
 Cuba
-
 Cyprus
-
 Czechia
-
 DR Congo
-
 Denmark
-
 Dominican Republic
-
 Ecuador
-
 Egypt
-
 El Salvador
-
 Estonia
-
 Eswatini
-
 Ethiopia
-
 Finland
-
 France
-
 Georgia
-
 Germany
-
 Ghana
-
 Greece
-
 Haiti
-
 Hong Kong
-
 Hungary
-
 India
-
 Indonesia
-
 Iran, Islamic republic
-
 Iraq
-
 Ireland
-
 Israel
-
 Italy
-
 Jamaica
-
 Japan
-
 Jordan
-
 Kazakhstan
-
 Kenya
-
 Korea
-
 Kuwait
-
 Kyrgyzstan
-
 Laos
-
 Latvia
-
 Lebanon
-
 Lesotho
-
 Libya
-
 Lithuania
-
 Luxembourg
-
 Madagascar
-
 Malaysia
-
 Malta
-
 Mauritius
-
 Mexico
-
 Moldova
-
 Mongolia
-
 Montenegro
-
 Morocco
-
 Mozambique
-
 Myanmar
-
 Namibia
-
 Nepal
-
 Netherlands
-
 New Zealand
-
 Nigeria
-
 North Macedonia
-
 Norway
-
 Oman
-
 Pakistan
-
 Palestine
-
 Panama
-
 Papua New Guinea
-
 Paraguay
-
 Peru
-
 Philippines
-
 Poland
-
 Portugal
-
 Puerto Rico
-
 Qatar
-
 Reunion
-
 Romania
-
 Rwanda
-
 Saudi Arabia
-
 Serbia
-
 Singapore
-
 Slovakia
-
 Slovenia
-
 Somalia
-
 South Africa
-
 Spain
-
 Sri Lanka
-
 Sweden
-
 Switzerland
-
 Syria
-
 Taiwan
-
 Tajikistan
-
 Tanzania
-
 Thailand
-
 Trinidad and Tobago
-
 Tunisia
-
 Turkey
-
 UAE
-
 Uganda
-
 Ukraine
-
 United Kingdom
-
United States
-
 Uruguay
-
 Uzbekistan
-
 Venezuela
-
 Vietnam
-
 Yemen
-
 Zambia
-
 Zimbabwe
- Forex
- Crypto












