

The Graph technical analysis: $0.02565 support under pressure after network migration news

The Graph (GRT) is trading at $0.02839, down 7.55% on the day after gapping lower by $0.00151 and hovering near session lows. The asset is positioned below its key moving averages but remains above long-term support levels.
 0.02056
0.02314000
Highlights
- The Graph Foundation will migrate query traffic from Subgraph Studio to the main Graph Network, increasing visibility and throughput for its primary protocol.
- This operational change centralizes network utilization across BNB Smart Chain and Polygon, providing more transparent and reliable usage metrics.
- GRT/USD trades below key moving averages with strong downside momentum, and is projected to stay within $0.02564858 to $0.03113142 over 2 to 3 days, with a 78% chance of further declines.
Protocol migration boosts network transparency amid sustained selling pressure
The Graph Foundation's decision to migrate query traffic from Subgraph Studio to the main Graph Network represents a structural shift in how data and indexing activity are handled, enhancing the primary protocol's visibility and throughput, according to Headtopics. This move, which will also affect BNB Smart Chain and Polygon, is expected to centralize network utilization and may provide a stronger indication of real usage metrics to the ecosystem. The operational update supports a more transparent view of on-chain activity, though price action has remained under broader selling pressure.
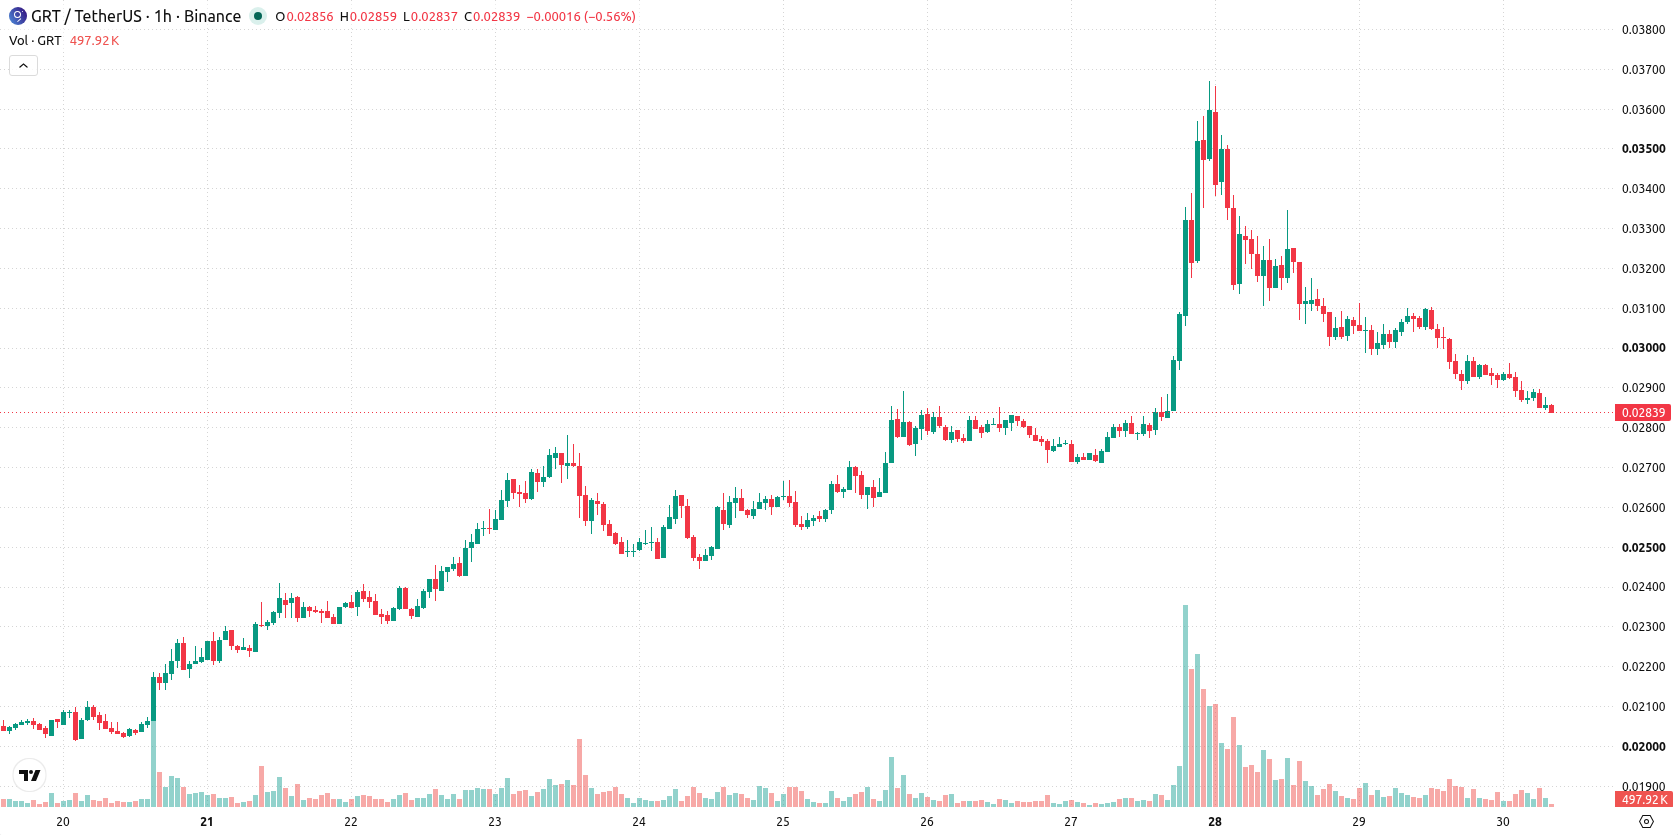
Persistent bearish momentum as price hovers below key averages
GRT/USD is positioned below the MA-20 and MA-50 on the H1 timeframe, confirming that short- and medium-term momentum remains negative. The price maintains a hold above the daily MA-200, providing longer-term structural support, while immediate resistance is marked by the Ichimoku Kijun level at $0.02973. Momentum indicators reinforce this setup: MACD signals ongoing downside, while ADX is neutral, indicating a lack of clear trend strength. Both RSI and CCI display oversold conditions, and Stochastic RSI is also deeply oversold, suggesting the pair may be stretched on the downside. Bull/Bear Power and the Awesome Oscillator both point to lingering bearish pressure.
Downside risk dominates outlook under strict resistance cap
Over the coming 2 to 3 trading days, GRT/USD is likely to fluctuate within a typical volatility band of $0.02564858 to $0.03113142. The statistical probability points to a 78% chance of further downward movement and just a 22% chance of an upside reversal in the near term. Any recovery scenario would require a clear break above the $0.02973 resistance level, while further losses could accelerate if the price drops below $0.02565.
Earlier, analysts noted that The Graph was demonstrating strong bullish momentum but warned that extreme overbought conditions could introduce significant short-term volatility. The latest price action and momentum indicators now signal a reversal of that trend, making the $0.02565 support level a crucial threshold for traders to monitor in the coming sessions.











-
 Afghanistan
-
 Albania
-
 Algeria
-
 Angola
-
 Argentina
-
 Armenia
-
 Australia
-
 Austria
-
 Azerbaijan
-
 Bahamas
-
 Bahrain
-
 Bangladesh
-
 Belarus
-
 Belgium
-
 Bolivia
-
 Botswana
-
 Brazil
-
 Brunei
-
 Bulgaria
-
 Cambodia
-
 Cameroon
-
 Canada
-
 Chile
-
 China
-
 Colombia
-
 Congo
-
 Costa Rica
-
 Cote d'Ivoire
-
 Croatia
-
 Cuba
-
 Cyprus
-
 Czechia
-
 DR Congo
-
 Denmark
-
 Dominican Republic
-
 Ecuador
-
 Egypt
-
 El Salvador
-
 Estonia
-
 Eswatini
-
 Ethiopia
-
 Finland
-
 France
-
 Georgia
-
 Germany
-
 Ghana
-
 Greece
-
 Haiti
-
 Hong Kong
-
 Hungary
-
 India
-
 Indonesia
-
 Iran, Islamic republic
-
 Iraq
-
 Ireland
-
 Israel
-
 Italy
-
 Jamaica
-
 Japan
-
 Jordan
-
 Kazakhstan
-
 Kenya
-
 Korea
-
 Kuwait
-
 Kyrgyzstan
-
 Laos
-
 Latvia
-
 Lebanon
-
 Lesotho
-
 Libya
-
 Lithuania
-
 Luxembourg
-
 Madagascar
-
 Malaysia
-
 Malta
-
 Mauritius
-
 Mexico
-
 Moldova
-
 Mongolia
-
 Montenegro
-
 Morocco
-
 Mozambique
-
 Myanmar
-
 Namibia
-
 Nepal
-
 Netherlands
-
 New Zealand
-
 Nigeria
-
 North Macedonia
-
 Norway
-
 Oman
-
 Pakistan
-
 Palestine
-
 Panama
-
 Papua New Guinea
-
 Paraguay
-
 Peru
-
 Philippines
-
 Poland
-
 Portugal
-
 Puerto Rico
-
 Qatar
-
 Reunion
-
 Romania
-
 Rwanda
-
 Saudi Arabia
-
 Serbia
-
 Singapore
-
 Slovakia
-
 Slovenia
-
 Somalia
-
 South Africa
-
 Spain
-
 Sri Lanka
-
 Sweden
-
 Switzerland
-
 Syria
-
 Taiwan
-
 Tajikistan
-
 Tanzania
-
 Thailand
-
 Trinidad and Tobago
-
 Tunisia
-
 Turkey
-
 UAE
-
 Uganda
-
 Ukraine
-
 United Kingdom
-
United States
-
 Uruguay
-
 Uzbekistan
-
 Venezuela
-
 Vietnam
-
 Yemen
-
 Zambia
-
 Zimbabwe
- Forex
- Crypto












