

The Graph surges over 17% after strong buying pressure and technical strength

The Graph (GRT) surged 17.28% today on the back of robust technical momentum and heavy buying pressure. The strength of the move is supported by prices trading above all major moving averages, but extremely overbought conditions signal potential exhaustion near-term.
 0.02056
0.02314000
Highlights
- GRT/USD is trading with strong upward momentum above key moving averages across all time frames.
- Technical indicators show overbought conditions and strong intraday buyer dominance, as price gained 17.28% and volatility increased to 8.17%.
- GRT/USD is expected to fluctuate between $0.02612 and $0.03918 over the next five days, with over 80% probability of further gains.
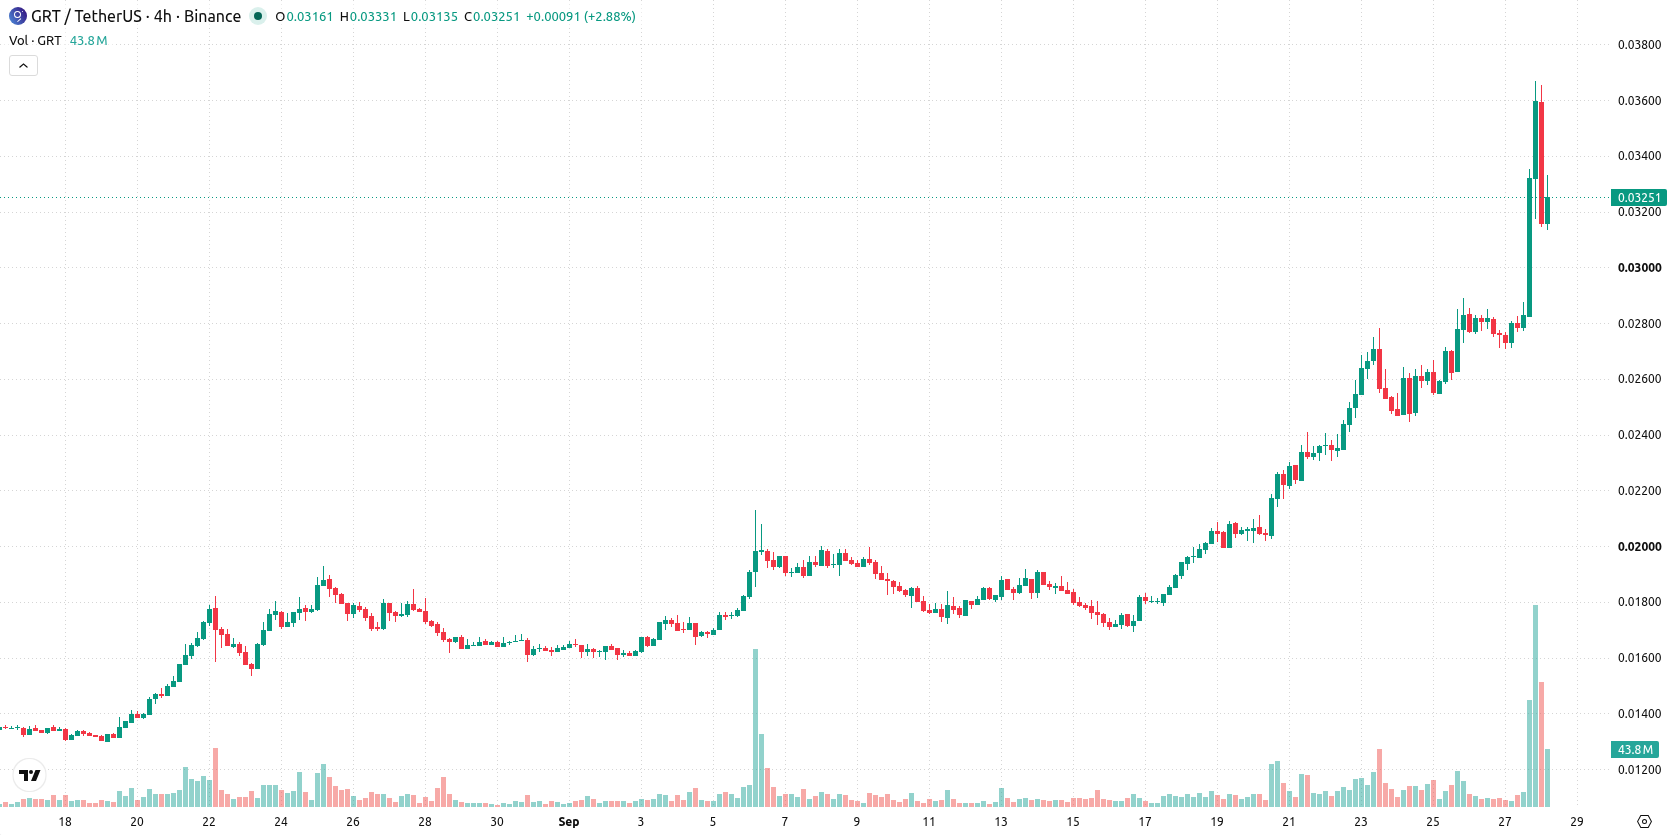
Overbought risk as bullish momentum meets technical boundaries
GRT/USD is trading above its 20-day, 50-day, and 200-day moving averages at $0.021782, $0.018251, and $0.02105 respectively, which points to strong bullish momentum for short, medium, and long-term trends. Support sits at $0.02612, while immediate resistance is near $0.0338. The Ichimoku Kijun at $0.0249 highlights the overall uptrend, though the MA-50 vs MA-200 dynamic remains bearish on a broader scale. Technical indicators confirm intense buying: MACD and ADX flash strong buy signals, the RSI is deeply overbought at 85.15, Stochastic RSI is at 100, and the CCI runs high at 186.65, all suggesting upward exhaustion ahead. Bull/Bear Power at 0.0089 confirms buyers are dominant, and the Awesome Oscillator reinforces the bullish picture. GRT/USD gained $0.00481 or 17.28% on the day, opening with a 29.02% upside gap and currently trades close to the session low. Daily intraday volatility at 8.17% reflects notable uncertainty and some price pressure after the open. Momentum and intraday trading confirm strong demand, but overbought readings raise caution for late long entries.
Earlier, analysts noted that The Graph was maintaining a bullish pattern, with technical momentum fueling the likelihood of further gains. The current analysis strengthens this outlook with fresh confirmation of persistent upside momentum, but warns that extreme overbought conditions could spark a period of heightened volatility and rapid shifts around the $0.02612-$0.03918 band.











-
 Afghanistan
-
 Albania
-
 Algeria
-
 Angola
-
 Argentina
-
 Armenia
-
 Australia
-
 Austria
-
 Azerbaijan
-
 Bahamas
-
 Bahrain
-
 Bangladesh
-
 Belarus
-
 Belgium
-
 Bolivia
-
 Botswana
-
 Brazil
-
 Brunei
-
 Bulgaria
-
 Cambodia
-
 Cameroon
-
 Canada
-
 Chile
-
 China
-
 Colombia
-
 Congo
-
 Costa Rica
-
 Cote d'Ivoire
-
 Croatia
-
 Cuba
-
 Cyprus
-
 Czechia
-
 DR Congo
-
 Denmark
-
 Dominican Republic
-
 Ecuador
-
 Egypt
-
 El Salvador
-
 Estonia
-
 Eswatini
-
 Ethiopia
-
 Finland
-
 France
-
 Georgia
-
 Germany
-
 Ghana
-
 Greece
-
 Haiti
-
 Hong Kong
-
 Hungary
-
 India
-
 Indonesia
-
 Iran, Islamic republic
-
 Iraq
-
 Ireland
-
 Israel
-
 Italy
-
 Jamaica
-
 Japan
-
 Jordan
-
 Kazakhstan
-
 Kenya
-
 Korea
-
 Kuwait
-
 Kyrgyzstan
-
 Laos
-
 Latvia
-
 Lebanon
-
 Lesotho
-
 Libya
-
 Lithuania
-
 Luxembourg
-
 Madagascar
-
 Malaysia
-
 Malta
-
 Mauritius
-
 Mexico
-
 Moldova
-
 Mongolia
-
 Montenegro
-
 Morocco
-
 Mozambique
-
 Myanmar
-
 Namibia
-
 Nepal
-
 Netherlands
-
 New Zealand
-
 Nigeria
-
 North Macedonia
-
 Norway
-
 Oman
-
 Pakistan
-
 Palestine
-
 Panama
-
 Papua New Guinea
-
 Paraguay
-
 Peru
-
 Philippines
-
 Poland
-
 Portugal
-
 Puerto Rico
-
 Qatar
-
 Reunion
-
 Romania
-
 Rwanda
-
 Saudi Arabia
-
 Serbia
-
 Singapore
-
 Slovakia
-
 Slovenia
-
 Somalia
-
 South Africa
-
 Spain
-
 Sri Lanka
-
 Sweden
-
 Switzerland
-
 Syria
-
 Taiwan
-
 Tajikistan
-
 Tanzania
-
 Thailand
-
 Trinidad and Tobago
-
 Tunisia
-
 Turkey
-
 UAE
-
 Uganda
-
 Ukraine
-
 United Kingdom
-
United States
-
 Uruguay
-
 Uzbekistan
-
 Venezuela
-
 Vietnam
-
 Yemen
-
 Zambia
-
 Zimbabwe
- Forex
- Crypto












