


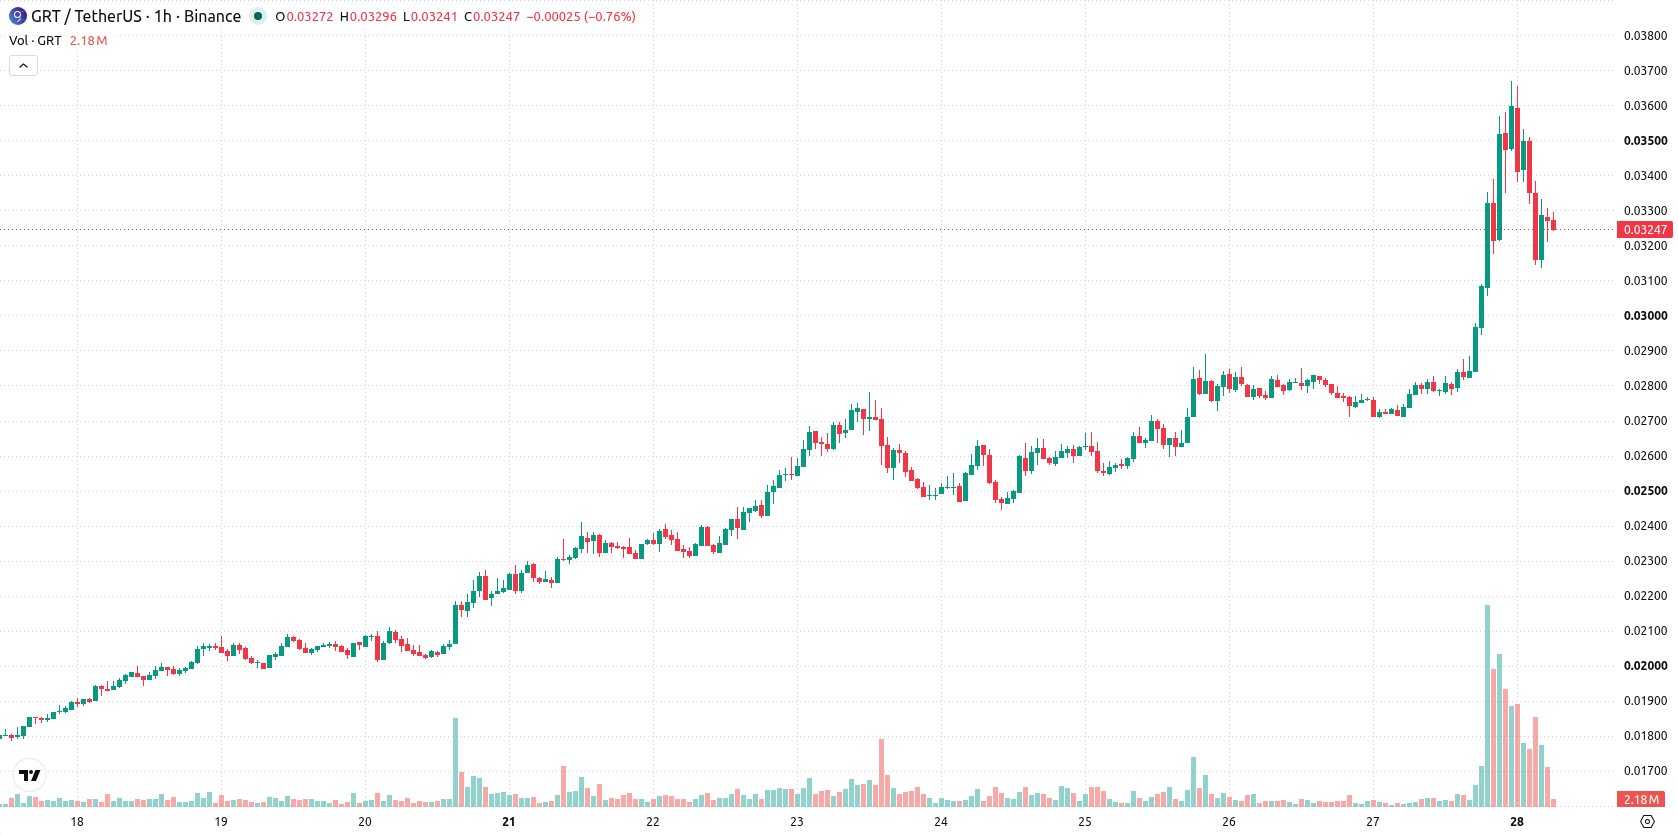
The Graph (GRT) is trading at $0.0326, rising 18.89% on the day. The price sits above its key moving averages, underscoring strong recent momentum.
 0.01898
0.02108000
Highlights
- GRT/USD trades well above key moving averages and near immediate support after rising 18.89% on the day.
- Technical indicators show strong upside momentum but a mildly oversold Stoch RSI and some divergence suggest consolidation risk.
- GRT/USD is projected to fluctuate between $0.02955224 and $0.03564776 over the next 2 to 3 days, with a 75% probability of upside.
Momentum signals mixed as bullish indicators meet neutral divergence
On the hourly chart, GRT is trading above the MA-20 at $0.031406 and MA-50 at $0.0292192, with the price also well above the MA-200 at $0.02105. The Ichimoku Kijun level at $0.03191 forms immediate support. Technical indicators show strong momentum: MACD and ADX are both in buy territory, RSI is at 55.5 indicating some remaining upside potential, and Stochastic RSI is oversold—suggesting a possible short-term pause or bounce. CCI is neutral, while Bull/Bear Power signals buyers leading the intraday trend. However, the Awesome Oscillator is neutral, and some oscillators display mild divergence versus momentum.
Upside bias favored as trading range narrows amid consolidation
Over the next 2 to 3 trading days, GRT/USD is likely to consolidate between $0.02955224 and $0.03564776. There is a 75% probability the price remains in an upside scenario and a 25% chance of a downside move. The baseline expectation is for the price to fluctuate within this corridor, with a breakout above the upper band opening the way for further gains and a drop below immediate support signaling a potential retracement.
Earlier, analysts noted that The Graph was maintaining a bullish pattern as technical momentum fueled further gains. The current analysis builds on this outlook by highlighting a period of likely price consolidation, with breakout levels at $0.03564776 and $0.02955224 providing key signals for the next directional move.










-
 Afghanistan
-
 Albania
-
 Algeria
-
 Angola
-
 Argentina
-
 Armenia
-
 Australia
-
 Austria
-
 Azerbaijan
-
 Bahamas
-
 Bahrain
-
 Bangladesh
-
 Belarus
-
 Belgium
-
 Bolivia
-
 Botswana
-
 Brazil
-
 Brunei
-
 Bulgaria
-
 Cambodia
-
 Cameroon
-
 Canada
-
 Chile
-
 China
-
 Colombia
-
 Congo
-
 Costa Rica
-
 Cote d'Ivoire
-
 Croatia
-
 Cuba
-
 Cyprus
-
 Czechia
-
 DR Congo
-
 Denmark
-
 Dominican Republic
-
 Ecuador
-
 Egypt
-
 El Salvador
-
 Estonia
-
 Eswatini
-
 Ethiopia
-
 Finland
-
 France
-
 Georgia
-
 Germany
-
 Ghana
-
 Greece
-
 Haiti
-
 Hong Kong
-
 Hungary
-
 India
-
 Indonesia
-
 Iran, Islamic republic
-
 Iraq
-
 Ireland
-
 Israel
-
 Italy
-
 Jamaica
-
 Japan
-
 Jordan
-
 Kazakhstan
-
 Kenya
-
 Korea
-
 Kuwait
-
 Kyrgyzstan
-
 Laos
-
 Latvia
-
 Lebanon
-
 Lesotho
-
 Libya
-
 Lithuania
-
 Luxembourg
-
 Madagascar
-
 Malaysia
-
 Malta
-
 Mauritius
-
 Mexico
-
 Moldova
-
 Mongolia
-
 Montenegro
-
 Morocco
-
 Mozambique
-
 Myanmar
-
 Namibia
-
 Nepal
-
 Netherlands
-
 New Zealand
-
 Nigeria
-
 North Macedonia
-
 Norway
-
 Oman
-
 Pakistan
-
 Palestine
-
 Panama
-
 Papua New Guinea
-
 Paraguay
-
 Peru
-
 Philippines
-
 Poland
-
 Portugal
-
 Puerto Rico
-
 Qatar
-
 Reunion
-
 Romania
-
 Rwanda
-
 Saudi Arabia
-
 Serbia
-
 Singapore
-
 Slovakia
-
 Slovenia
-
 Somalia
-
 South Africa
-
 Spain
-
 Sri Lanka
-
 Sweden
-
 Switzerland
-
 Syria
-
 Taiwan
-
 Tajikistan
-
 Tanzania
-
 Thailand
-
 Trinidad and Tobago
-
 Tunisia
-
 Turkey
-
 UAE
-
 Uganda
-
 Ukraine
-
 United Kingdom
-
United States
-
 Uruguay
-
 Uzbekistan
-
 Venezuela
-
 Vietnam
-
 Yemen
-
 Zambia
-
 Zimbabwe
- Forex
- Crypto












