

Why is Render falling today? Support levels to watch as sellers pressure $1.93

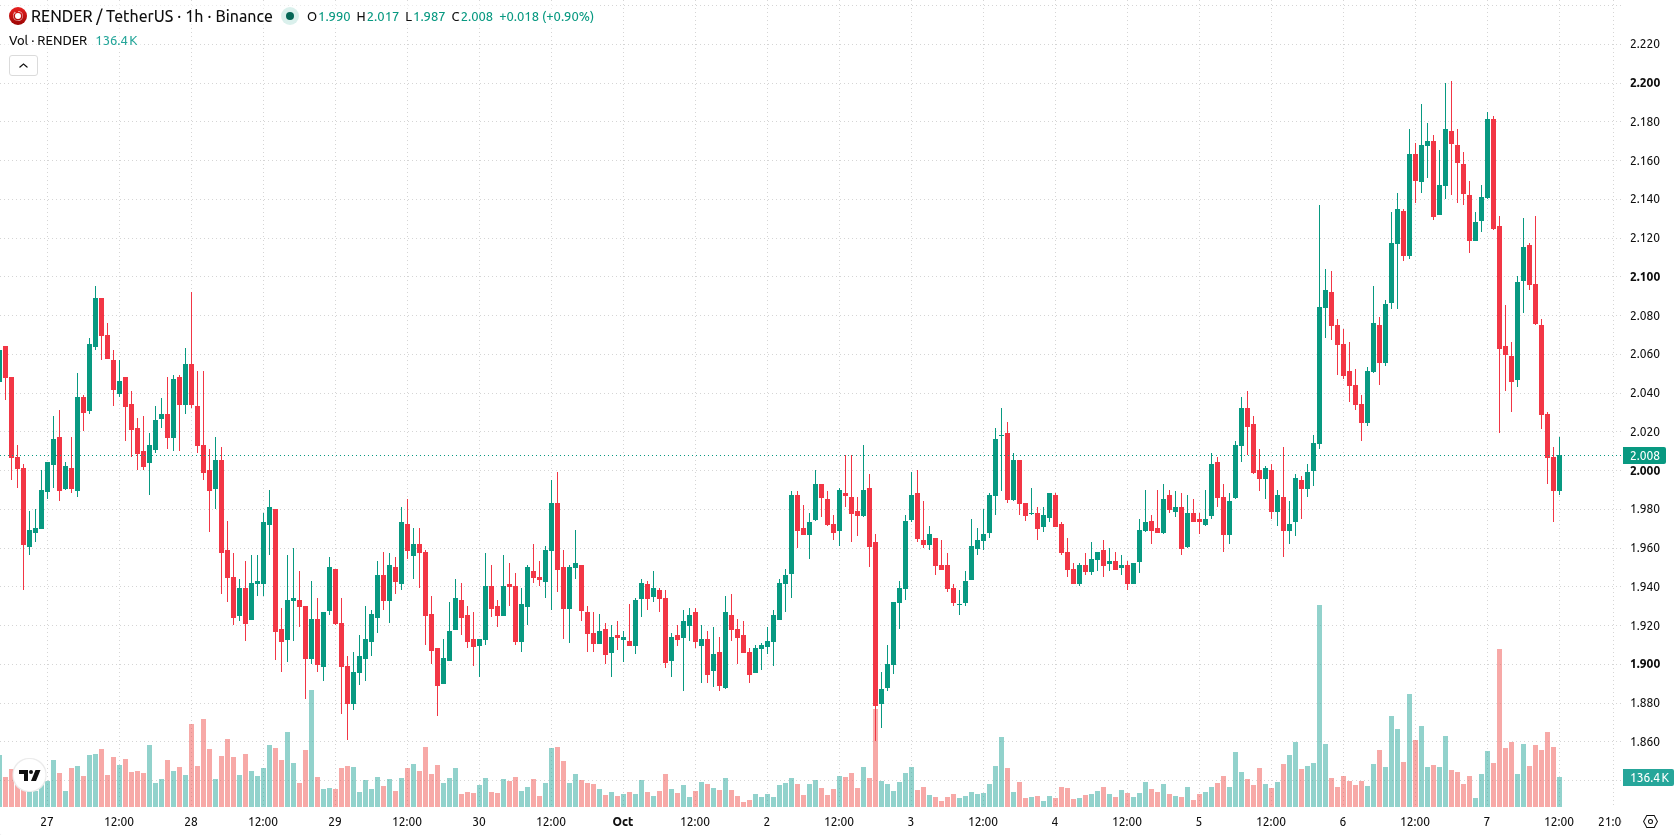
Render (RENDER) is trading at $2.01 after falling 6.78% today, marking a sharp decline and closing session near its low. The asset is currently positioned below its key short- and medium-term moving averages, indicating broad selling momentum.
 1.597
1.7710
Highlights
- Render trades below key short- and medium-term moving averages but holds above longer-term support, indicating sustained selling pressure with longer-term support intact.
- Negative momentum dominates as the asset is oversold on multiple indicators, with today’s 6.78% decline and high volatility confirming current weakness.
- Next-day price is expected to range between $1.93 and $2.0832, with a 79% probability of further downside unless price breaks above $2.097.
Intraday momentum weakens as price tests short-term resistance
On the h1 chart, RENDER trades below MA-20 at $2.10 and MA-50 at $2.07, reflecting ongoing selling pressure. Price remains above the daily MA-200, now at $1.67, which provides longer-term support. The Ichimoku Kijun at $2.097 is acting as immediate resistance. Momentum indicators are negative: MACD and ADX both confirm strong selling, with RSI at 36 and both Stoch RSI and CCI holding in oversold territory. Bull/Bear Power further signals intraday seller dominance, while the Awesome Oscillator is also aligned with the negative momentum backdrop.
Consolidation risk rises as sellers outnumber bulls in short term
Looking ahead to the next trading day, the expected price range for RENDER is $1.93 to $2.08 based on typical volatility. There is a 21% probability of an upward move versus a 79% probability of continued decline. The most likely scenario is consolidation between $1.93 support and resistance at $2.097. A bullish reversal would require a breakout above the Kijun level, while a move below $1.93 opens the way for further declines if strong selling persists.
Previously it was reported that Render was building sustained bullish momentum supported by strong technical indicators across multiple timeframes. The current shift below key moving averages and an increased probability of further decline mark a notable change in trend, with traders advised to monitor the $1.93 support for signs of deeper downside risk.










-
 Afghanistan
-
 Albania
-
 Algeria
-
 Angola
-
 Argentina
-
 Armenia
-
 Australia
-
 Austria
-
 Azerbaijan
-
 Bahamas
-
 Bahrain
-
 Bangladesh
-
 Belarus
-
 Belgium
-
 Bolivia
-
 Botswana
-
 Brazil
-
 Brunei
-
 Bulgaria
-
 Cambodia
-
 Cameroon
-
 Canada
-
 Chile
-
 China
-
 Colombia
-
 Congo
-
 Costa Rica
-
 Cote d'Ivoire
-
 Croatia
-
 Cuba
-
 Cyprus
-
 Czechia
-
 DR Congo
-
 Denmark
-
 Dominican Republic
-
 Ecuador
-
 Egypt
-
 El Salvador
-
 Estonia
-
 Eswatini
-
 Ethiopia
-
 Finland
-
 France
-
 Georgia
-
 Germany
-
 Ghana
-
 Greece
-
 Haiti
-
 Hong Kong
-
 Hungary
-
 India
-
 Indonesia
-
 Iran, Islamic republic
-
 Iraq
-
 Ireland
-
 Israel
-
 Italy
-
 Jamaica
-
 Japan
-
 Jordan
-
 Kazakhstan
-
 Kenya
-
 Korea
-
 Kuwait
-
 Kyrgyzstan
-
 Laos
-
 Latvia
-
 Lebanon
-
 Lesotho
-
 Libya
-
 Lithuania
-
 Luxembourg
-
 Madagascar
-
 Malaysia
-
 Malta
-
 Mauritius
-
 Mexico
-
 Moldova
-
 Mongolia
-
 Montenegro
-
 Morocco
-
 Mozambique
-
 Myanmar
-
 Namibia
-
 Nepal
-
 Netherlands
-
 New Zealand
-
 Nigeria
-
 North Macedonia
-
 Norway
-
 Oman
-
 Pakistan
-
 Palestine
-
 Panama
-
 Papua New Guinea
-
 Paraguay
-
 Peru
-
 Philippines
-
 Poland
-
 Portugal
-
 Puerto Rico
-
 Qatar
-
 Reunion
-
 Romania
-
 Rwanda
-
 Saudi Arabia
-
 Serbia
-
 Singapore
-
 Slovakia
-
 Slovenia
-
 Somalia
-
 South Africa
-
 Spain
-
 Sri Lanka
-
 Sweden
-
 Switzerland
-
 Syria
-
 Taiwan
-
 Tajikistan
-
 Tanzania
-
 Thailand
-
 Trinidad and Tobago
-
 Tunisia
-
 Turkey
-
 UAE
-
 Uganda
-
 Ukraine
-
 United Kingdom
-
United States
-
 Uruguay
-
 Uzbekistan
-
 Venezuela
-
 Vietnam
-
 Yemen
-
 Zambia
-
 Zimbabwe
- Forex
- Crypto












