

Raydium gains over 10% after buyers dominate on positive momentum signals

Raydium (RAY) surged 10.3% on strong technical momentum and continued buying pressure, with the advance reflecting a decisive push above major moving averages. The move is supported by a robust bullish trend in both short- and long-term indicators, with price action testing resistance bands and momentum signals solidly positive.
 1.4122
1.6143
Highlights
- RAY token moved higher without any confirmed catalyst, announcement, regulatory action, or technical change affecting Raydium protocol operations.
- Trading volume for Raydium was below its monthly average and the decentralized exchange continues normal activity on Solana.
- RAY trades above key moving averages with strong bullish signals and is forecast to move between $2.1554 to $2.6998 in the next five days.
Muted trading activity as rally occurs without clear catalyst
Recent updates on Raydium indicate that the token's move happened without any confirmed underlying catalyst or event. Trading volumes were below the monthly average and no specific announcements, regulatory actions, or technical changes linked to the Raydium protocol were reported. The decentralized exchange protocol continues to function normally on the Solana network, with its RAY token being used as the associated utility token.
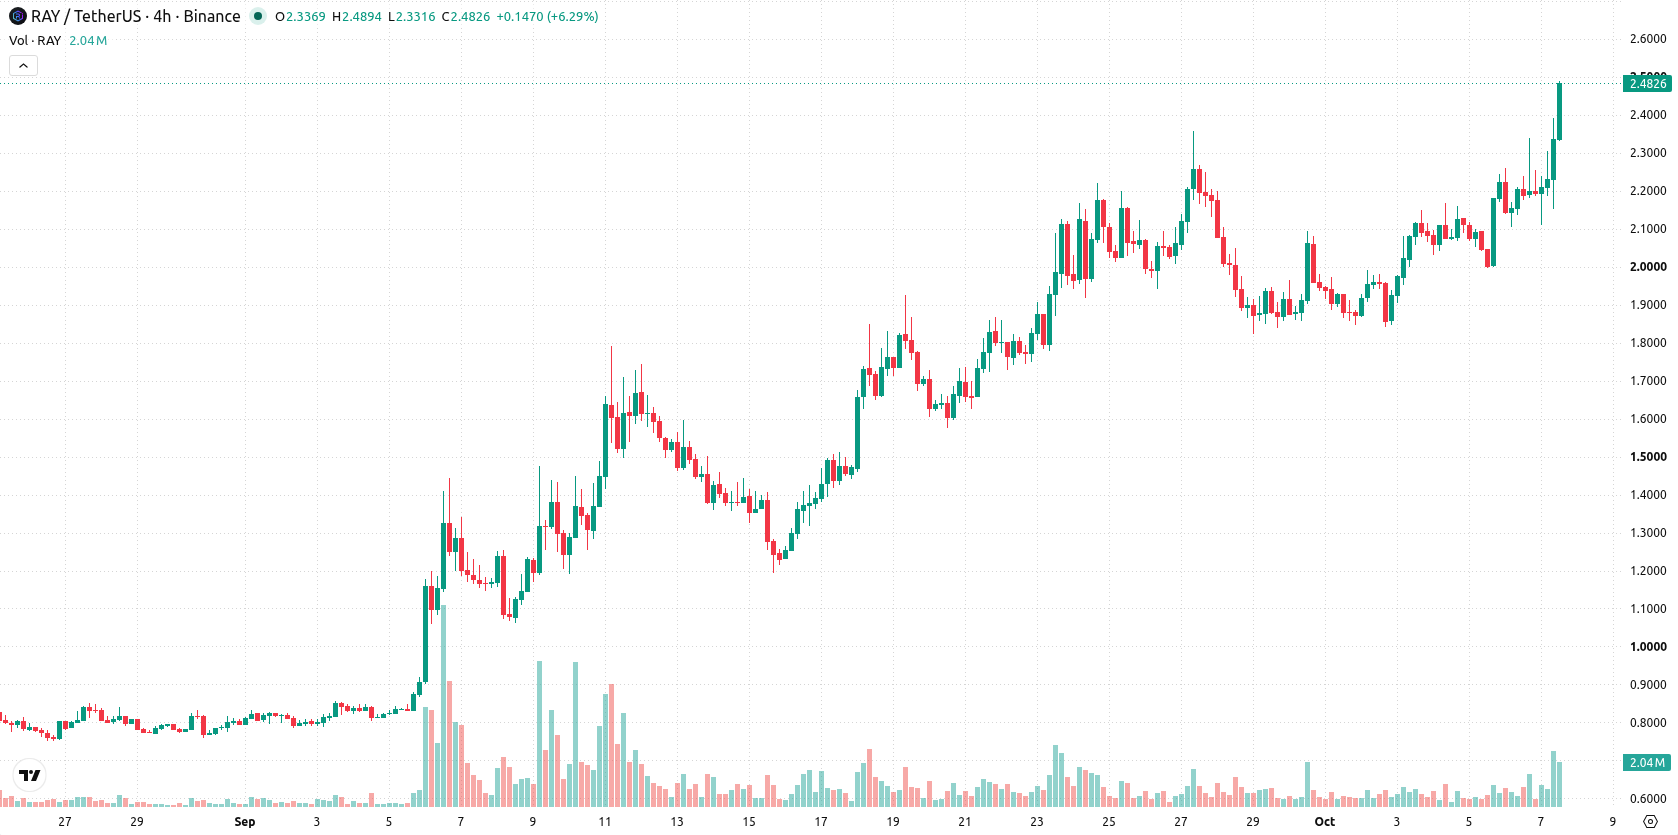
Bullish signals strengthen as price nears overbought and volatility rises
RAY/USD is trading above its 20-day ($1.9411), 50-day ($1.3712), and 200-day ($0.8443) moving averages, confirming a robust bullish structure in the short, medium, and long term. The nearest support is seen at $2.3378 with near-term resistance at $2.6998, and the alignment of the 50-day and 200-day moving averages signals a bullish longer-term trend. Momentum signals are firmly positive: the Moving Average Convergence Divergence (MACD) and Average Directional Index (ADX) both point to continued buying strength. The Relative Strength Index (RSI) at 68.2416 nears overbought territory and the Commodity Channel Index (CCI) has entered overbought levels, while Stochastic RSI remains neutral. Bull/Bear Power (BBP) is positive, indicating buyers dominate intraday momentum, and the Awesome Oscillator is neutral. The current price of $2.4509 marks a gain of 0.2288, or 10.3% daily, after opening with a downside gap of roughly -1.31%. The price is trading near session highs, with intraday volatility at 8.44%, showing clear strength toward the upper end of the daily range. However, the Hull Moving Average (HMA) signals a short-term sell, suggesting some divergence within the indicators.
Previously it was reported that Raydium demonstrated strong bullish momentum, supported by robust technical indicators and sustained buying activity. The latest analysis reinforces this view, as persistent positive momentum and a high probability of continued upward movement place the $2.6998 resistance as a critical level to monitor for potential breakout opportunities.










-
 Afghanistan
-
 Albania
-
 Algeria
-
 Angola
-
 Argentina
-
 Armenia
-
 Australia
-
 Austria
-
 Azerbaijan
-
 Bahamas
-
 Bahrain
-
 Bangladesh
-
 Belarus
-
 Belgium
-
 Bolivia
-
 Botswana
-
 Brazil
-
 Brunei
-
 Bulgaria
-
 Cambodia
-
 Cameroon
-
 Canada
-
 Chile
-
 China
-
 Colombia
-
 Congo
-
 Costa Rica
-
 Cote d'Ivoire
-
 Croatia
-
 Cuba
-
 Cyprus
-
 Czechia
-
 DR Congo
-
 Denmark
-
 Dominican Republic
-
 Ecuador
-
 Egypt
-
 El Salvador
-
 Estonia
-
 Eswatini
-
 Ethiopia
-
 Finland
-
 France
-
 Georgia
-
 Germany
-
 Ghana
-
 Greece
-
 Haiti
-
 Hong Kong
-
 Hungary
-
 India
-
 Indonesia
-
 Iran, Islamic republic
-
 Iraq
-
 Ireland
-
 Israel
-
 Italy
-
 Jamaica
-
 Japan
-
 Jordan
-
 Kazakhstan
-
 Kenya
-
 Korea
-
 Kuwait
-
 Kyrgyzstan
-
 Laos
-
 Latvia
-
 Lebanon
-
 Lesotho
-
 Libya
-
 Lithuania
-
 Luxembourg
-
 Madagascar
-
 Malaysia
-
 Malta
-
 Mauritius
-
 Mexico
-
 Moldova
-
 Mongolia
-
 Montenegro
-
 Morocco
-
 Mozambique
-
 Myanmar
-
 Namibia
-
 Nepal
-
 Netherlands
-
 New Zealand
-
 Nigeria
-
 North Macedonia
-
 Norway
-
 Oman
-
 Pakistan
-
 Palestine
-
 Panama
-
 Papua New Guinea
-
 Paraguay
-
 Peru
-
 Philippines
-
 Poland
-
 Portugal
-
 Puerto Rico
-
 Qatar
-
 Reunion
-
 Romania
-
 Rwanda
-
 Saudi Arabia
-
 Serbia
-
 Singapore
-
 Slovakia
-
 Slovenia
-
 Somalia
-
 South Africa
-
 Spain
-
 Sri Lanka
-
 Sweden
-
 Switzerland
-
 Syria
-
 Taiwan
-
 Tajikistan
-
 Tanzania
-
 Thailand
-
 Trinidad and Tobago
-
 Tunisia
-
 Turkey
-
 UAE
-
 Uganda
-
 Ukraine
-
 United Kingdom
-
United States
-
 Uruguay
-
 Uzbekistan
-
 Venezuela
-
 Vietnam
-
 Yemen
-
 Zambia
-
 Zimbabwe
- Forex
- Crypto












