


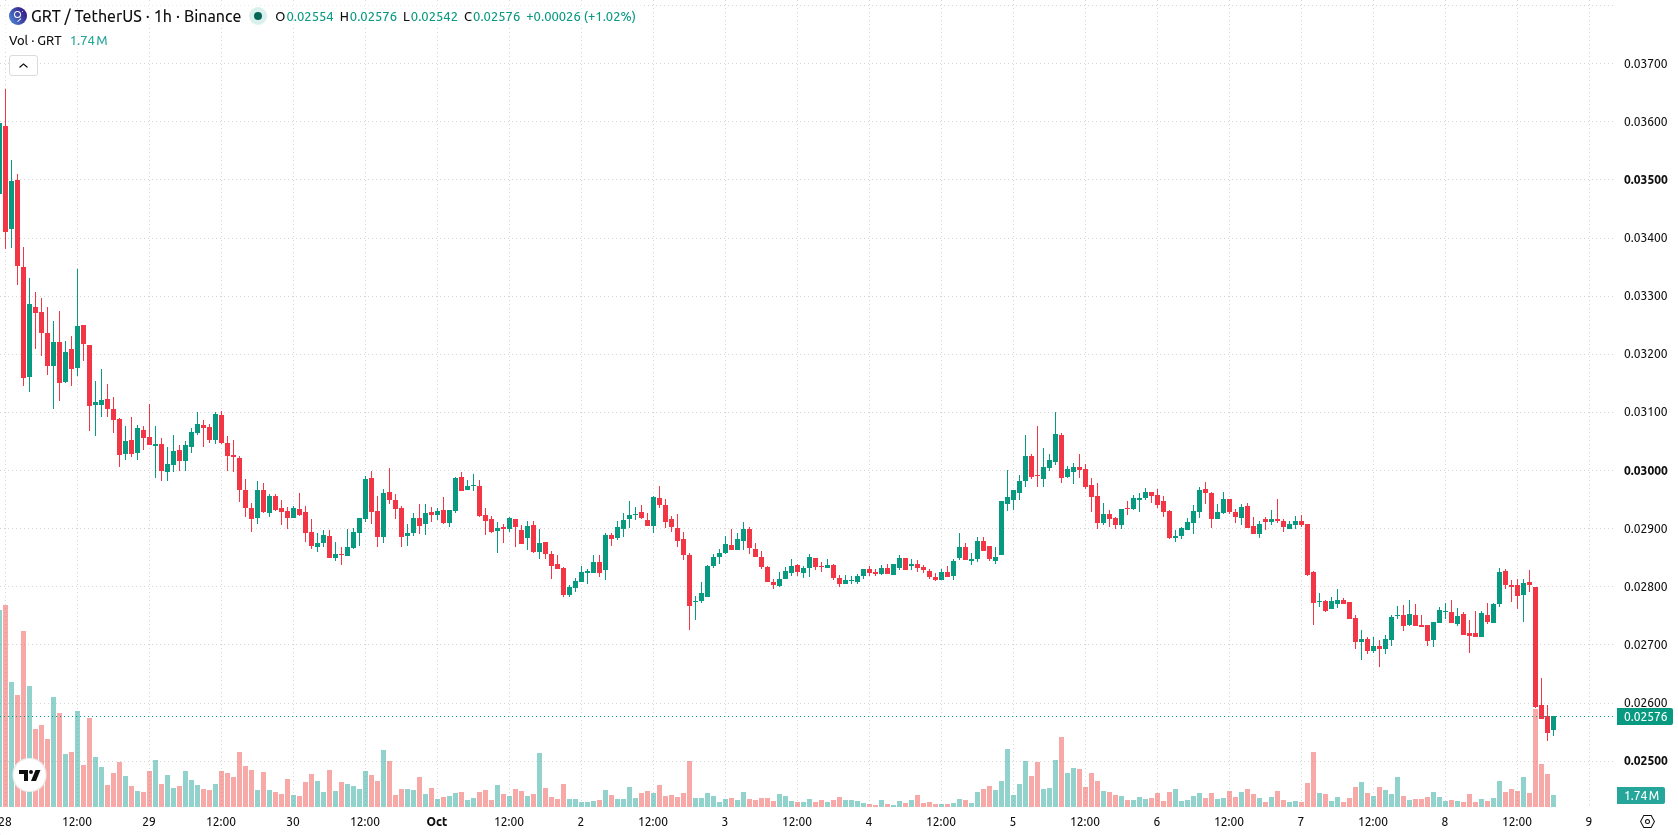
The Graph (GRT) is trading at $0.0255, down 7.98% on the day, and remains below its key moving averages.
 0.02027
0.02314000
Highlights
- GRT/USD trades below short- and medium-term moving averages, indicating ongoing selling pressure in the near term.
- Momentum and trend indicators confirm further downside risk, with most readings in oversold territory and sellers dominating.
- GRT/USD is expected to consolidate between $0.02451837 and $0.02648163, with a 77% probability of further short-term declines.
Seller momentum persists as key support remains unbroken
On the H1 chart, GRT/USD is trading below both the MA-20 and MA-50, indicating short- and medium-term selling pressure. However, it remains well above the daily MA-200, suggesting that long-term support is still intact. The Ichimoku Kijun at $0.02697 serves as immediate resistance. Momentum readings remain weak, as MACD and ADX signal further downside, while the RSI is at 31 and both CCI and Stochastic RSI are in oversold territory, indicating stretched conditions. Bull/Bear Power confirms seller dominance, and the Awesome Oscillator is neutral and does not provide trend confirmation.
Sideways consolidation expected as downside risk dominates
Over the next sessions, GRT/USD is expected to trade within a range of $0.02451837 to $0.02648163. The probability of an upward move is low at 23%, while the likelihood of a further decline stands at 77%. The baseline scenario calls for consolidation within this sideways corridor. A bullish scenario would require the price to reclaim and sustain levels above the immediate resistance at $0.02697, while bearish continuation would develop if the price breaks below the forecast support area.
Earlier, analysts noted that The Graph was experiencing renewed downside momentum and faced persistent selling pressure, with risk tilted to the downside. The current analysis affirms this bearish outlook, highlighting key technical thresholds; traders should closely monitor the $0.02697 resistance level for signs of a potential shift in trend.











-
 Afghanistan
-
 Albania
-
 Algeria
-
 Angola
-
 Argentina
-
 Armenia
-
 Australia
-
 Austria
-
 Azerbaijan
-
 Bahamas
-
 Bahrain
-
 Bangladesh
-
 Belarus
-
 Belgium
-
 Bolivia
-
 Botswana
-
 Brazil
-
 Brunei
-
 Bulgaria
-
 Cambodia
-
 Cameroon
-
 Canada
-
 Chile
-
 China
-
 Colombia
-
 Congo
-
 Costa Rica
-
 Cote d'Ivoire
-
 Croatia
-
 Cuba
-
 Cyprus
-
 Czechia
-
 DR Congo
-
 Denmark
-
 Dominican Republic
-
 Ecuador
-
 Egypt
-
 El Salvador
-
 Estonia
-
 Eswatini
-
 Ethiopia
-
 Finland
-
 France
-
 Georgia
-
 Germany
-
 Ghana
-
 Greece
-
 Haiti
-
 Hong Kong
-
 Hungary
-
 India
-
 Indonesia
-
 Iran, Islamic republic
-
 Iraq
-
 Ireland
-
 Israel
-
 Italy
-
 Jamaica
-
 Japan
-
 Jordan
-
 Kazakhstan
-
 Kenya
-
 Korea
-
 Kuwait
-
 Kyrgyzstan
-
 Laos
-
 Latvia
-
 Lebanon
-
 Lesotho
-
 Libya
-
 Lithuania
-
 Luxembourg
-
 Madagascar
-
 Malaysia
-
 Malta
-
 Mauritius
-
 Mexico
-
 Moldova
-
 Mongolia
-
 Montenegro
-
 Morocco
-
 Mozambique
-
 Myanmar
-
 Namibia
-
 Nepal
-
 Netherlands
-
 New Zealand
-
 Nigeria
-
 North Macedonia
-
 Norway
-
 Oman
-
 Pakistan
-
 Palestine
-
 Panama
-
 Papua New Guinea
-
 Paraguay
-
 Peru
-
 Philippines
-
 Poland
-
 Portugal
-
 Puerto Rico
-
 Qatar
-
 Reunion
-
 Romania
-
 Rwanda
-
 Saudi Arabia
-
 Serbia
-
 Singapore
-
 Slovakia
-
 Slovenia
-
 Somalia
-
 South Africa
-
 Spain
-
 Sri Lanka
-
 Sweden
-
 Switzerland
-
 Syria
-
 Taiwan
-
 Tajikistan
-
 Tanzania
-
 Thailand
-
 Trinidad and Tobago
-
 Tunisia
-
 Turkey
-
 UAE
-
 Uganda
-
 Ukraine
-
 United Kingdom
-
United States
-
 Uruguay
-
 Uzbekistan
-
 Venezuela
-
 Vietnam
-
 Yemen
-
 Zambia
-
 Zimbabwe
- Forex
- Crypto












