


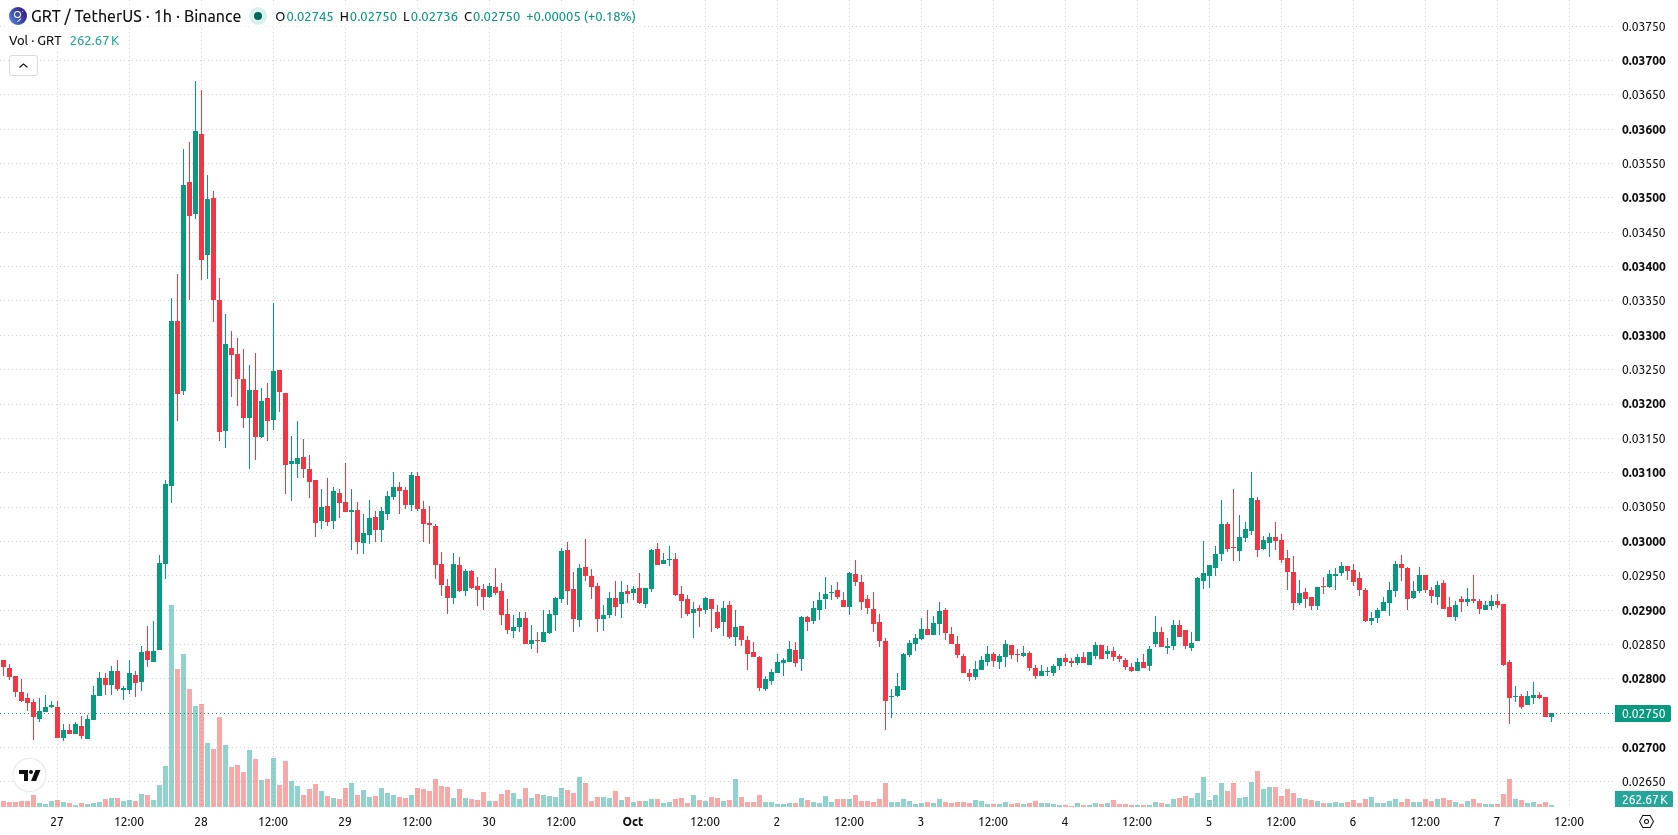
The Graph (GRT) is trading at $0.02761, down 7.22% on the day. The price is currently below its short- and medium-term moving averages but remains supported above its major long-term average.
 0.01694
0.01780000
Highlights
- GRT/USD trades below key short- and medium-term moving averages, indicating continued downward momentum.
- Momentum indicators remain strongly negative, with clear selling strength and multiple oversold readings.
- Price is expected to remain within a $0.02676924 to $0.02845076 range over the next 2 to 3 trading days.
Oversold momentum intensifies as sellers test intraday support
On the hourly timeframe, GRT/USD is positioned below the MA-20 and MA-50, while it continues to hold above the MA-200 on the daily chart. Immediate resistance is identified by the Ichimoku Kijun at $0.02857. Momentum indicators are heavily negative: MACD and ADX both point to strong selling strength, while RSI stands deep in oversold territory at 29, with both Stochastic RSI and CCI also highlighting oversold conditions. Bull/Bear Power suggests sellers are dominant in the intraday session, while the Awesome Oscillator remains neutral.
Downward pressure persists as rangebound outlook dominates
In the short term, GRT is expected to trade within a range of $0.02676924 to $0.02845076 over the next two to three trading days. The likelihood of an upward breakout is very low, while the probability of a downward move remains high. The base case scenario anticipates the price staying in this lateral band, with a bullish outcome requiring a sustained move above immediate resistance, and a bearish scenario triggered by a breakdown below current support.
Earlier, analysts noted that The Graph had shifted from a bearish phase to a more constructive trend as technical momentum improved. However, the latest data indicate a reversal in short-term momentum, with downside risk prevailing unless the price can reclaim and maintain levels above immediate resistance.











-
 Afghanistan
-
 Albania
-
 Algeria
-
 Angola
-
 Argentina
-
 Armenia
-
 Australia
-
 Austria
-
 Azerbaijan
-
 Bahamas
-
 Bahrain
-
 Bangladesh
-
 Belarus
-
 Belgium
-
 Bolivia
-
 Botswana
-
 Brazil
-
 Brunei
-
 Bulgaria
-
 Cambodia
-
 Cameroon
-
 Canada
-
 Chile
-
 China
-
 Colombia
-
 Congo
-
 Costa Rica
-
 Cote d'Ivoire
-
 Croatia
-
 Cuba
-
 Cyprus
-
 Czechia
-
 DR Congo
-
 Denmark
-
 Dominican Republic
-
 Ecuador
-
 Egypt
-
 El Salvador
-
 Estonia
-
 Eswatini
-
 Ethiopia
-
 Finland
-
 France
-
 Georgia
-
 Germany
-
 Ghana
-
 Greece
-
 Haiti
-
 Hong Kong
-
 Hungary
-
 India
-
 Indonesia
-
 Iran, Islamic republic
-
 Iraq
-
 Ireland
-
 Israel
-
 Italy
-
 Jamaica
-
 Japan
-
 Jordan
-
 Kazakhstan
-
 Kenya
-
 Korea
-
 Kuwait
-
 Kyrgyzstan
-
 Laos
-
 Latvia
-
 Lebanon
-
 Lesotho
-
 Libya
-
 Lithuania
-
 Luxembourg
-
 Madagascar
-
 Malaysia
-
 Malta
-
 Mauritius
-
 Mexico
-
 Moldova
-
 Mongolia
-
 Montenegro
-
 Morocco
-
 Mozambique
-
 Myanmar
-
 Namibia
-
 Nepal
-
 Netherlands
-
 New Zealand
-
 Nigeria
-
 North Macedonia
-
 Norway
-
 Oman
-
 Pakistan
-
 Palestine
-
 Panama
-
 Papua New Guinea
-
 Paraguay
-
 Peru
-
 Philippines
-
 Poland
-
 Portugal
-
 Puerto Rico
-
 Qatar
-
 Reunion
-
 Romania
-
 Rwanda
-
 Saudi Arabia
-
 Serbia
-
 Singapore
-
 Slovakia
-
 Slovenia
-
 Somalia
-
 South Africa
-
 Spain
-
 Sri Lanka
-
 Sweden
-
 Switzerland
-
 Syria
-
 Taiwan
-
 Tajikistan
-
 Tanzania
-
 Thailand
-
 Trinidad and Tobago
-
 Tunisia
-
 Turkey
-
 UAE
-
 Uganda
-
 Ukraine
-
 United Kingdom
-
United States
-
 Uruguay
-
 Uzbekistan
-
 Venezuela
-
 Vietnam
-
 Yemen
-
 Zambia
-
 Zimbabwe
- Forex
- Crypto












