

Aptos holds gains as buyers stay in control: weekly analysis

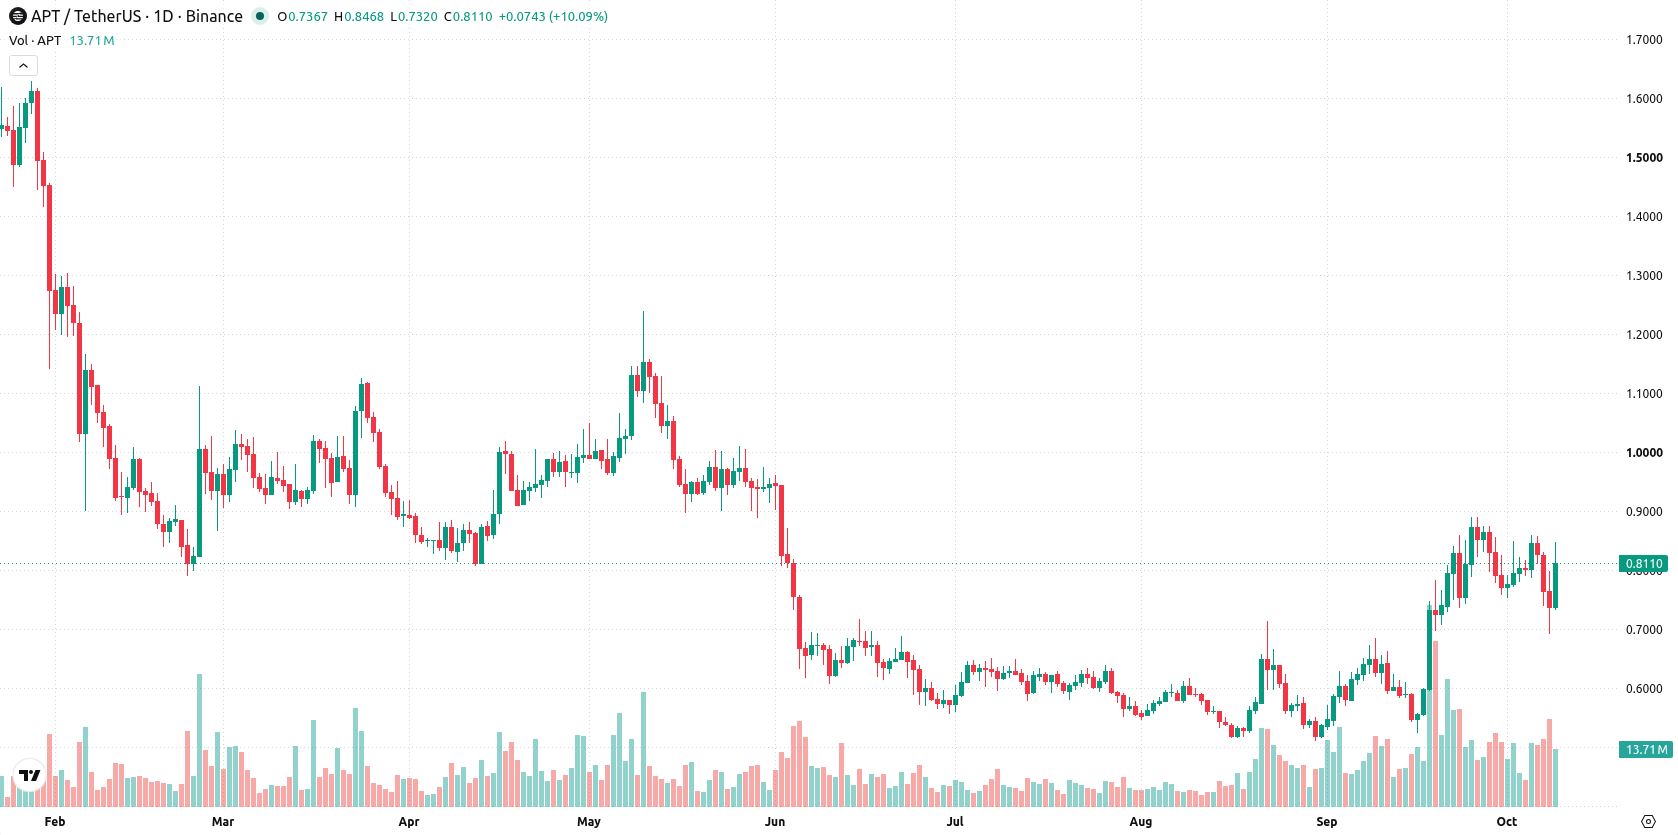
Aptos (APT) is holding near $0.81 after a roughly 1.4% dip over the week, as technical indicators send mixed signals with high volatility and divided momentum. The daily chart shows buyers are maintaining some control despite weak price movements, setting up a tentative balance between support and resistance for the days ahead.
 0.4549
0.5666
Highlights
- Aptos declined 1.44% over the past 7 days to $0.8085, with high weekly volatility at 24.4%.
- Technical indicators present mixed signals, with a moderate bullish structure, but both CCI and Stochastic RSI remain oversold.
- Forecast range for next week is $0.7192 to $0.8977, with base trading between $0.7989 and $0.8595 unless key levels break.
Emission cuts and new proposals reshape sentiment as major vesting ends
Aptos completed the four-year vesting period for early contributors, with the final token distribution occurring on October 12, 2026, which sharply reduced monthly APT emissions by about 60%, according to cryptonews.net. The Aptos Foundation also pledged to lock and permanently stake 210 million APT — around 37% of its mainnet supply — shifting its funding model away from future token sales, as PANews and cryptobriefing.com reported. Additional proposals are under review, including a hard supply cap, a cut to staking rewards, and a steep increase in gas fees, while Aptos Labs introduced the MonoMove smart contract engine now in test, per blockonomi.com.
Divergent signals emerge as MACD turns bullish despite oversold oscillators
On the daily chart, Aptos has shown a sustained move lower with a firm trend, but price strength above key moving averages leaves the technical picture divided. While MACD signals a strong buy and ADX shows a clear directional bias, both the CCI and Stochastic RSI are in the oversold zone. Volatility for the week stands high at 24.4%, underlining active trading conditions. Immediate support is near $0.7989, with resistance at $0.8595.
Directional bias leans bullish as range breakout risks intensify next week
Next week, the forecast range is $0.7192 to $0.8977, with a 55% probability of an increase and a 45% chance of a decrease. The base case is continued trading between $0.7989 and $0.8595. A break above $0.8595 would open a bullish scenario toward the upper end of the range, while a drop below $0.7989 could see further declines toward support near $0.7192.
Earlier, analysts noted that supply-side constraints and foundation-led staking activities had reinforced a constructive backdrop for Aptos, supporting a cautiously bullish bias despite technical headwinds. As current technicals show heightened volatility and a split momentum profile, traders should closely monitor the $0.7989 support level, as a decisive move below it could shift the risk profile and signal further downside toward $0.7192.










-
 Afghanistan
-
 Albania
-
 Algeria
-
 Angola
-
 Argentina
-
 Armenia
-
 Australia
-
 Austria
-
 Azerbaijan
-
 Bahamas
-
 Bahrain
-
 Bangladesh
-
 Belarus
-
 Belgium
-
 Bolivia
-
 Botswana
-
 Brazil
-
 Brunei
-
 Bulgaria
-
 Cambodia
-
 Cameroon
-
 Canada
-
 Chile
-
 China
-
 Colombia
-
 Congo
-
 Costa Rica
-
 Cote d'Ivoire
-
 Croatia
-
 Cuba
-
 Cyprus
-
 Czechia
-
 DR Congo
-
 Denmark
-
 Dominican Republic
-
 Ecuador
-
 Egypt
-
 El Salvador
-
 Estonia
-
 Eswatini
-
 Ethiopia
-
 Finland
-
 France
-
 Georgia
-
 Germany
-
 Ghana
-
 Greece
-
 Haiti
-
 Hong Kong
-
 Hungary
-
 India
-
 Indonesia
-
 Iran, Islamic republic
-
 Iraq
-
 Ireland
-
 Israel
-
 Italy
-
 Jamaica
-
 Japan
-
 Jordan
-
 Kazakhstan
-
 Kenya
-
 Korea
-
 Kuwait
-
 Kyrgyzstan
-
 Laos
-
 Latvia
-
 Lebanon
-
 Lesotho
-
 Libya
-
 Lithuania
-
 Luxembourg
-
 Madagascar
-
 Malaysia
-
 Malta
-
 Mauritius
-
 Mexico
-
 Moldova
-
 Mongolia
-
 Montenegro
-
 Morocco
-
 Mozambique
-
 Myanmar
-
 Namibia
-
 Nepal
-
 Netherlands
-
 New Zealand
-
 Nigeria
-
 North Macedonia
-
 Norway
-
 Oman
-
 Pakistan
-
 Palestine
-
 Panama
-
 Papua New Guinea
-
 Paraguay
-
 Peru
-
 Philippines
-
 Poland
-
 Portugal
-
 Puerto Rico
-
 Qatar
-
 Reunion
-
 Romania
-
 Rwanda
-
 Saudi Arabia
-
 Serbia
-
 Singapore
-
 Slovakia
-
 Slovenia
-
 Somalia
-
 South Africa
-
 Spain
-
 Sri Lanka
-
 Sweden
-
 Switzerland
-
 Syria
-
 Taiwan
-
 Tajikistan
-
 Tanzania
-
 Thailand
-
 Trinidad and Tobago
-
 Tunisia
-
 Turkey
-
 UAE
-
 Uganda
-
 Ukraine
-
 United Kingdom
-
United States
-
 Uruguay
-
 Uzbekistan
-
 Venezuela
-
 Vietnam
-
 Yemen
-
 Zambia
-
 Zimbabwe
- Forex
- Crypto












