

Polkadot price forecast: Resistance test looms after DOT-backed stablecoin expansion plans

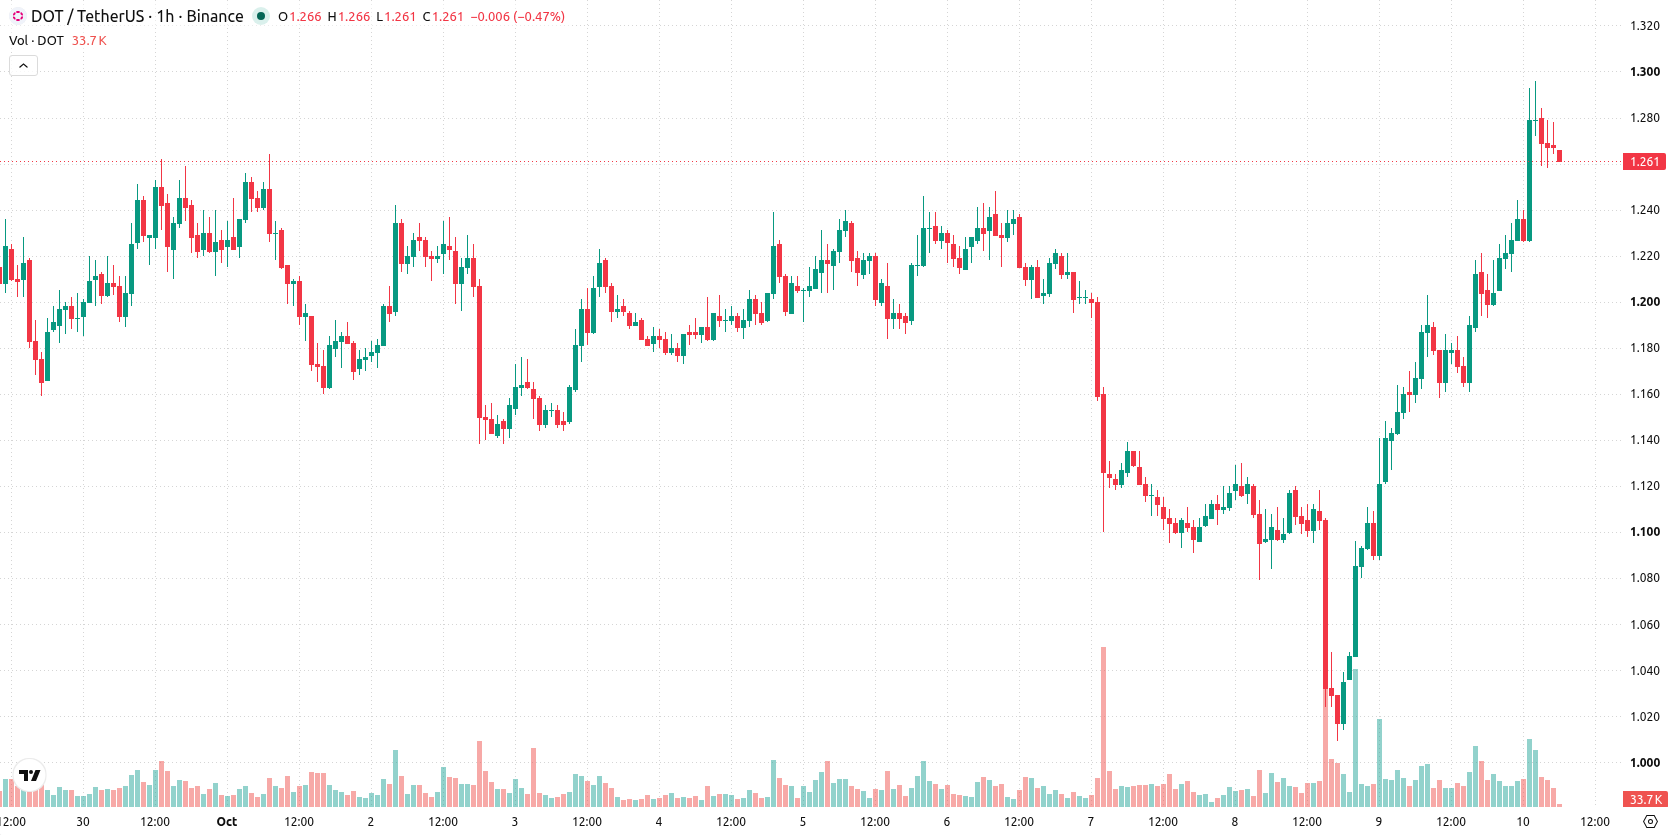
Polkadot (DOT) is trading at $1.266, climbing 9.04% on the day in an upward move. The price sits well above its key moving averages, confirming a strong positive momentum in the short and medium term.
 0.737
0.872
Highlights
- Polkadot introduced its decentralized stablecoin dotUSD on mainnet under the OpenGov framework, advancing its DeFi functionality.
- dotUSD uses USDT for initial collateral and governance approval reached 98.4% of DOT holders, with future plans for DOT-backed collateral and flexible redemption.
- DOT/USD trades with strong bullish momentum and is forecast to range between $1.213 and $1.319 over the next 2 to 3 days, with some indicators showing potential overbought conditions.
Stablecoin launch and governance gains bolster DeFi adoption prospects
Polkadot has launched its native stablecoin, dotUSD, on mainnet under the OpenGov governance framework, which introduces a decentralized and community-driven stablecoin model to the ecosystem. The stablecoin is initially collateralized by USDT and managed through a process approved by 98.4% of participating DOT holders, reflecting robust stakeholder engagement and reinforcing trust in platform governance, according to Cryptotimes. This move enhances Polkadot's utility for DeFi applications and positions the network for broader adoption. Looking ahead, the planned rollout of DOT-backed collateral and a flexible redemption mechanism, as reported by Coingabbar, is likely to sustain momentum and further catalyze demand for the token.
Bullish momentum firm as technical signals show overbought risk
On the technical front, DOT/USD trades above the MA-20 at $1.214 and MA-50 at $1.149 on the H1 chart, and remains well above the MA-200 ($1.052). The Ichimoku Kijun line at $1.219 serves as the immediate support level. Indicator readings confirm firm bullish momentum: MACD and ADX are positive, RSI is elevated at 71.25 (Buy), CCI signals overbought, and Bull/Bear Power shows buyers dominating. Stochastic RSI is neutral, while the Awesome Oscillator remains flat, indicating that the uptrend is robust but some oscillators are signaling potential overbought conditions.
Range-bound trading likely as support and resistance levels define outlook
Over the next 2–3 trading days, DOT/USD is likely to consolidate within the $1.213 to $1.319 range. The baseline scenario favors price stabilizing in a sideways corridor after recent gains. If resistance is breached, the market could see a move toward the upper end of the forecast range. Conversely, if support near $1.219 fails, a pullback toward the lower boundary of the range may occur, though current probability for a significant decline remains very low.
Earlier, analysts noted that Polkadot’s launch of its native dotUSD stablecoin represented a pivotal development for the network’s DeFi ecosystem and introduced greater technical volatility. The current setup strengthens this view with confirmation of strong upward momentum, positioning $1.219 as a key level to monitor for potential shifts in trend direction in the coming sessions.










-
 Afghanistan
-
 Albania
-
 Algeria
-
 Angola
-
 Argentina
-
 Armenia
-
 Australia
-
 Austria
-
 Azerbaijan
-
 Bahamas
-
 Bahrain
-
 Bangladesh
-
 Belarus
-
 Belgium
-
 Bolivia
-
 Botswana
-
 Brazil
-
 Brunei
-
 Bulgaria
-
 Cambodia
-
 Cameroon
-
 Canada
-
 Chile
-
 China
-
 Colombia
-
 Congo
-
 Costa Rica
-
 Cote d'Ivoire
-
 Croatia
-
 Cuba
-
 Cyprus
-
 Czechia
-
 DR Congo
-
 Denmark
-
 Dominican Republic
-
 Ecuador
-
 Egypt
-
 El Salvador
-
 Estonia
-
 Eswatini
-
 Ethiopia
-
 Finland
-
 France
-
 Georgia
-
 Germany
-
 Ghana
-
 Greece
-
 Haiti
-
 Hong Kong
-
 Hungary
-
 India
-
 Indonesia
-
 Iran, Islamic republic
-
 Iraq
-
 Ireland
-
 Israel
-
 Italy
-
 Jamaica
-
 Japan
-
 Jordan
-
 Kazakhstan
-
 Kenya
-
 Korea
-
 Kuwait
-
 Kyrgyzstan
-
 Laos
-
 Latvia
-
 Lebanon
-
 Lesotho
-
 Libya
-
 Lithuania
-
 Luxembourg
-
 Madagascar
-
 Malaysia
-
 Malta
-
 Mauritius
-
 Mexico
-
 Moldova
-
 Mongolia
-
 Montenegro
-
 Morocco
-
 Mozambique
-
 Myanmar
-
 Namibia
-
 Nepal
-
 Netherlands
-
 New Zealand
-
 Nigeria
-
 North Macedonia
-
 Norway
-
 Oman
-
 Pakistan
-
 Palestine
-
 Panama
-
 Papua New Guinea
-
 Paraguay
-
 Peru
-
 Philippines
-
 Poland
-
 Portugal
-
 Puerto Rico
-
 Qatar
-
 Reunion
-
 Romania
-
 Rwanda
-
 Saudi Arabia
-
 Serbia
-
 Singapore
-
 Slovakia
-
 Slovenia
-
 Somalia
-
 South Africa
-
 Spain
-
 Sri Lanka
-
 Sweden
-
 Switzerland
-
 Syria
-
 Taiwan
-
 Tajikistan
-
 Tanzania
-
 Thailand
-
 Trinidad and Tobago
-
 Tunisia
-
 Turkey
-
 UAE
-
 Uganda
-
 Ukraine
-
 United Kingdom
-
United States
-
 Uruguay
-
 Uzbekistan
-
 Venezuela
-
 Vietnam
-
 Yemen
-
 Zambia
-
 Zimbabwe
- Forex
- Crypto












