

GRT holds key support with buyers eyeing inflection points this week: weekly analysis

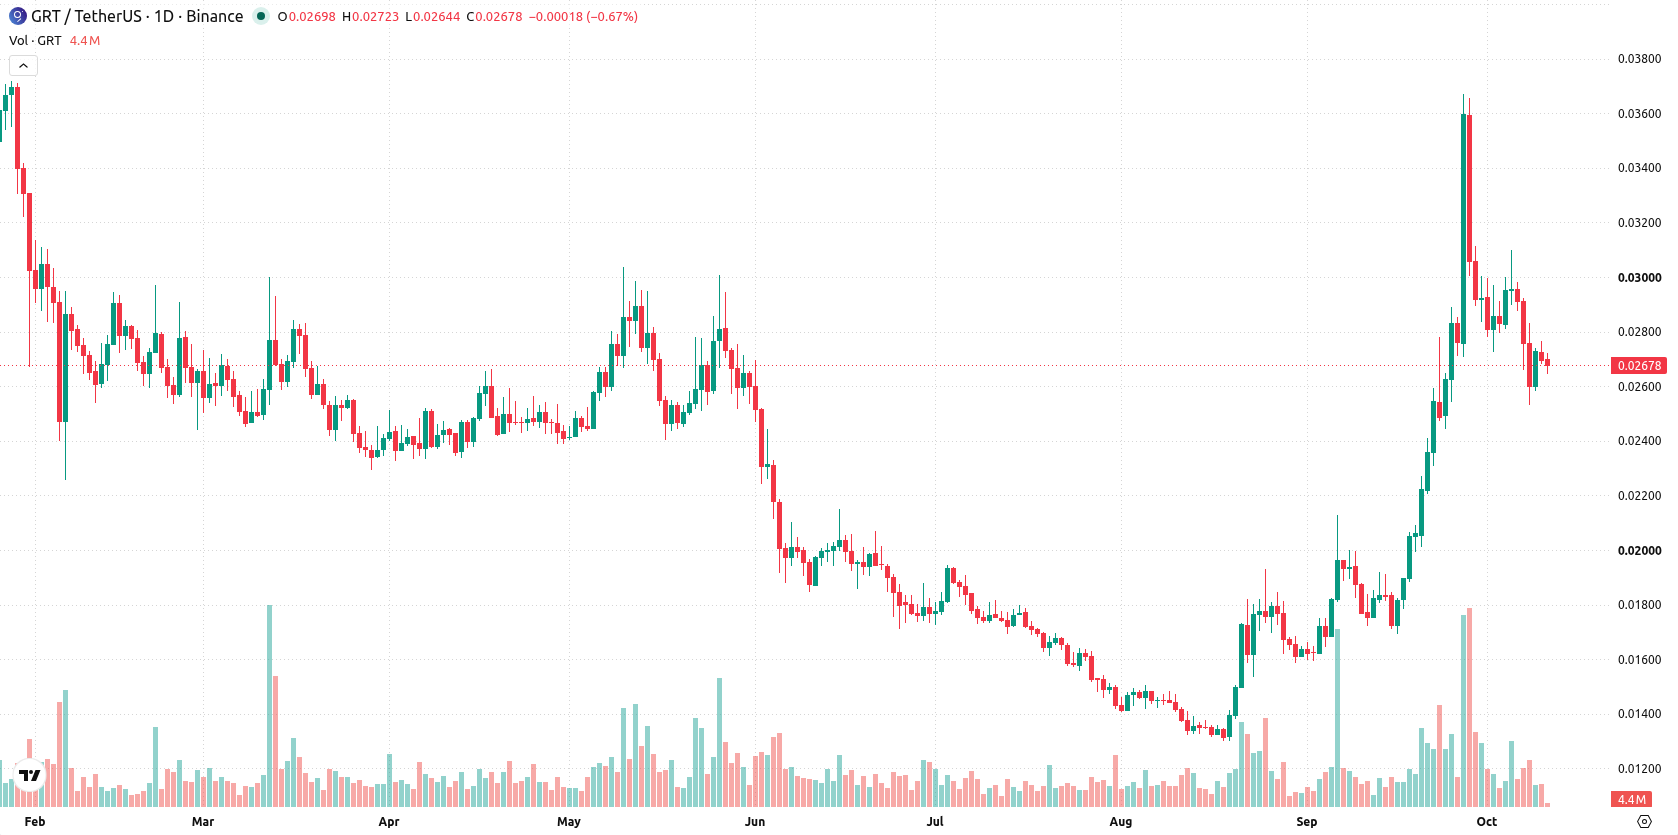
The Graph (GRT) hovered near $0.027 after a nearly 6% slide over the past week, underscoring persistent selling pressure. A steady downtrend has put support levels in focus as stretched momentum raises the chance for a technical rebound or at least a pause. The coming week will center on whether buyers can regain control at key inflection points.
 0.02027
0.02314000
Highlights
- The Graph trades at $0.02674 after dropping 5.91% in the past 7 days, positioned below its short-term moving average but above longer-term supports.
- Technical indicators show a persistent but possibly exhausted seller presence, with the daily chart in oversold territory and a firm downward trend.
- Expected price range for the next 7 days is $0.02373971 to $0.02974028, with a 71% probability of an upward move if resistance at $0.02681 is cleared.
Oversold signals grow as downside momentum dominates this week
On the daily chart, momentum reflects a sustained move lower with a firm trend, as shown by the recent decline and 22.38% volatility. The MACD and ADX both point to buyers remaining in control despite the loss, while the Stochastic RSI indicates the market is in the oversold zone at 8.41, highlighting persistent but potentially exhausted selling pressure. Immediate support stands at $0.02533, with resistance just above at the Ichimoku Kijun level of $0.02681, which price is currently testing. Together, this setup suggests that while downside momentum has been dominant, oversold conditions could soon prompt a rebound or at least a pause.
Bullish breakout hinges on resistance amid range-bound weekly outlook
For the next 7 days, the expected range is $0.02373971 to $0.02974028. There is a 71% probability of an increase versus 29% for a decrease. The base case is continued price action inside this range, with a bullish scenario unfolding if the price can break and close above resistance at $0.02681, opening the way for a recovery toward the upper end of the range. A bearish scenario would see the price fall through support at $0.02533, exposing further downside momentum.
Earlier, analysts noted that The Graph faced persistent selling pressure and a bearish technical outlook. The current analysis builds on this by highlighting potential for a near-term rebound should oversold conditions trigger a move above immediate resistance, making the $0.02681 level crucial to monitor for a shift in trend.











-
 Afghanistan
-
 Albania
-
 Algeria
-
 Angola
-
 Argentina
-
 Armenia
-
 Australia
-
 Austria
-
 Azerbaijan
-
 Bahamas
-
 Bahrain
-
 Bangladesh
-
 Belarus
-
 Belgium
-
 Bolivia
-
 Botswana
-
 Brazil
-
 Brunei
-
 Bulgaria
-
 Cambodia
-
 Cameroon
-
 Canada
-
 Chile
-
 China
-
 Colombia
-
 Congo
-
 Costa Rica
-
 Cote d'Ivoire
-
 Croatia
-
 Cuba
-
 Cyprus
-
 Czechia
-
 DR Congo
-
 Denmark
-
 Dominican Republic
-
 Ecuador
-
 Egypt
-
 El Salvador
-
 Estonia
-
 Eswatini
-
 Ethiopia
-
 Finland
-
 France
-
 Georgia
-
 Germany
-
 Ghana
-
 Greece
-
 Haiti
-
 Hong Kong
-
 Hungary
-
 India
-
 Indonesia
-
 Iran, Islamic republic
-
 Iraq
-
 Ireland
-
 Israel
-
 Italy
-
 Jamaica
-
 Japan
-
 Jordan
-
 Kazakhstan
-
 Kenya
-
 Korea
-
 Kuwait
-
 Kyrgyzstan
-
 Laos
-
 Latvia
-
 Lebanon
-
 Lesotho
-
 Libya
-
 Lithuania
-
 Luxembourg
-
 Madagascar
-
 Malaysia
-
 Malta
-
 Mauritius
-
 Mexico
-
 Moldova
-
 Mongolia
-
 Montenegro
-
 Morocco
-
 Mozambique
-
 Myanmar
-
 Namibia
-
 Nepal
-
 Netherlands
-
 New Zealand
-
 Nigeria
-
 North Macedonia
-
 Norway
-
 Oman
-
 Pakistan
-
 Palestine
-
 Panama
-
 Papua New Guinea
-
 Paraguay
-
 Peru
-
 Philippines
-
 Poland
-
 Portugal
-
 Puerto Rico
-
 Qatar
-
 Reunion
-
 Romania
-
 Rwanda
-
 Saudi Arabia
-
 Serbia
-
 Singapore
-
 Slovakia
-
 Slovenia
-
 Somalia
-
 South Africa
-
 Spain
-
 Sri Lanka
-
 Sweden
-
 Switzerland
-
 Syria
-
 Taiwan
-
 Tajikistan
-
 Tanzania
-
 Thailand
-
 Trinidad and Tobago
-
 Tunisia
-
 Turkey
-
 UAE
-
 Uganda
-
 Ukraine
-
 United Kingdom
-
United States
-
 Uruguay
-
 Uzbekistan
-
 Venezuela
-
 Vietnam
-
 Yemen
-
 Zambia
-
 Zimbabwe
- Forex
- Crypto












