

Ethereum Classic down nearly 6% as sellers test lower boundaries: weekly analysis

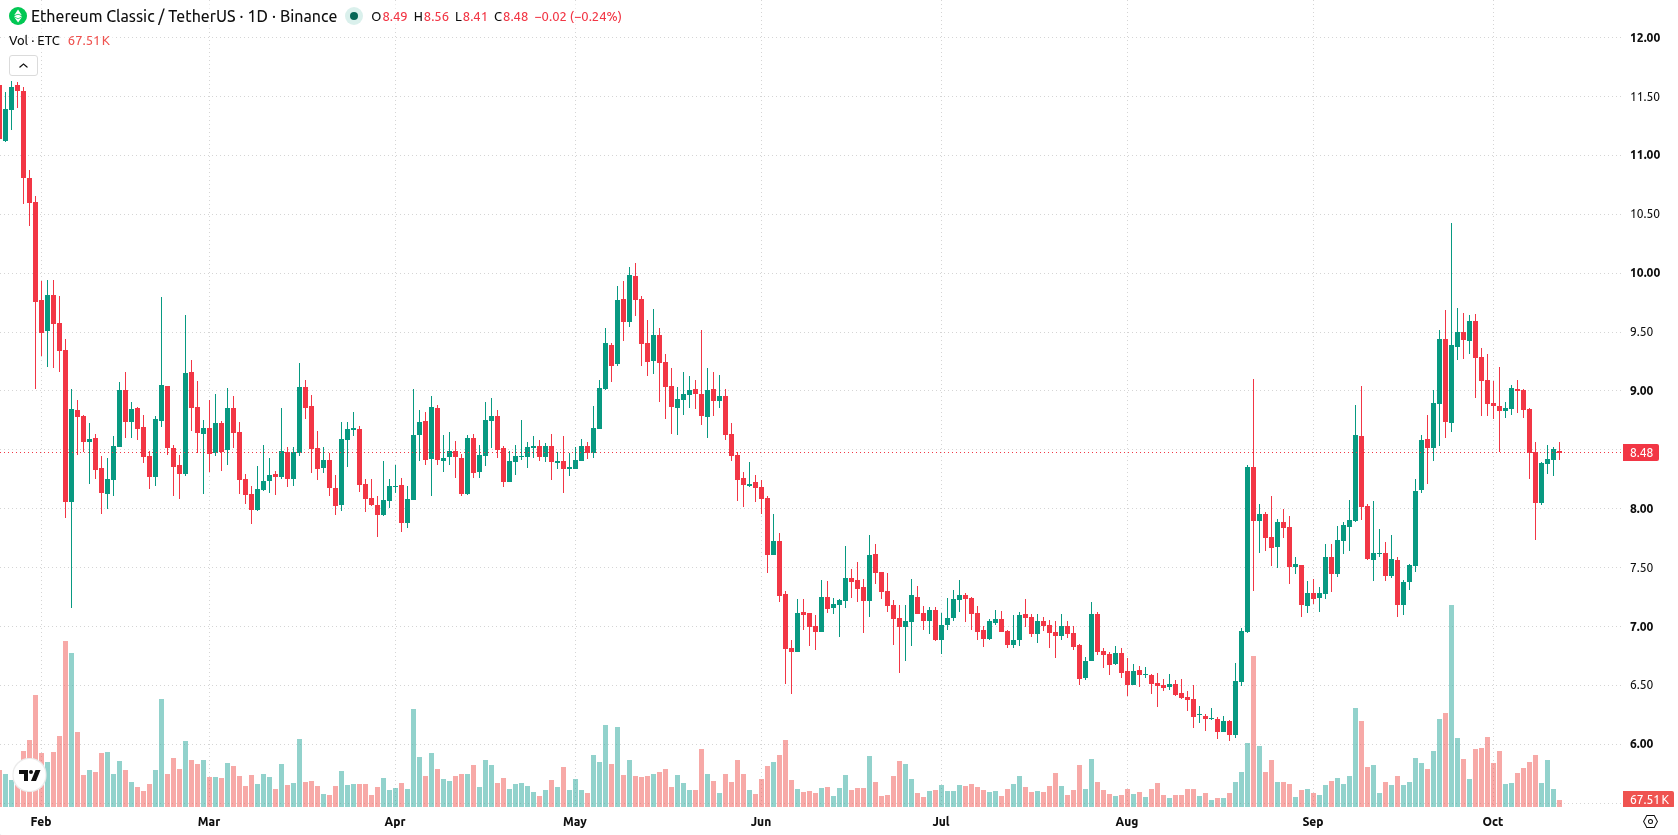
Ethereum Classic (ETC) has drifted lower over the past week toward the $8.50 zone, posting a drop of nearly 6% as downside momentum stretches the asset into oversold territory. This steady decline comes amid conflicting technical signals, with some indicators hinting at exhausted selling pressure even as the broader trend remains negative. Traders now focus on whether this setup can trigger a bounce or if further weakening will dominate in the coming days.
 7.19
7.750000
Highlights
- Ethereum Classic trades at $8.48 after a 5.67% decline over the past week, maintaining a bullish long-term structure.
- MACD indicates strong buy momentum while the CCI is in the oversold zone, signaling exhausted selling pressure with recent price weakness.
- Price is expected to range between $7.802687 and $9.62 with key support at $8.219 and resistance at $8.755.
Buoyant MACD and oversold CCI shape technical boundaries over the week
The daily chart shows a sustained move lower with a firm trend, underscored by 16.56% volatility over the past week. The MACD signals a strong buy, while the CCI is in the oversold zone at -105.485232, highlighting a mix of bullish momentum and exhausted selling pressure. Nearest support stands at $8.219, with resistance at $8.755 from the Ichimoku Kijun, suggesting that price action is set to respect these boundaries in the near term.
Directional outlook favors rebound if resistance breaks in the coming week
In the week ahead, the expected range is $7.802687 to $9.62, with a 67% probability of an increase versus a 33% probability of a decrease. The base case is continued trading between $8.219 and $8.755, with a break above resistance opening potential for a move toward $9.62. Conversely, a drop below $8.219 support could see a test of the lower bound near $7.802687.
In a recent review, analysts highlighted Ethereum Classic's underlying bullish bias despite evidence of short-term exhaustion and modest participation. The latest technical signals reinforce this view by suggesting that, while downside risk remains, a reversal could develop if the $8.219 support level holds in the days ahead.






Latest Ethereum Classic (ETC) News





-
 Afghanistan
-
 Albania
-
 Algeria
-
 Angola
-
 Argentina
-
 Armenia
-
 Australia
-
 Austria
-
 Azerbaijan
-
 Bahamas
-
 Bahrain
-
 Bangladesh
-
 Belarus
-
 Belgium
-
 Bolivia
-
 Botswana
-
 Brazil
-
 Brunei
-
 Bulgaria
-
 Cambodia
-
 Cameroon
-
 Canada
-
 Chile
-
 China
-
 Colombia
-
 Congo
-
 Costa Rica
-
 Cote d'Ivoire
-
 Croatia
-
 Cuba
-
 Cyprus
-
 Czechia
-
 DR Congo
-
 Denmark
-
 Dominican Republic
-
 Ecuador
-
 Egypt
-
 El Salvador
-
 Estonia
-
 Eswatini
-
 Ethiopia
-
 Finland
-
 France
-
 Georgia
-
 Germany
-
 Ghana
-
 Greece
-
 Haiti
-
 Hong Kong
-
 Hungary
-
 India
-
 Indonesia
-
 Iran, Islamic republic
-
 Iraq
-
 Ireland
-
 Israel
-
 Italy
-
 Jamaica
-
 Japan
-
 Jordan
-
 Kazakhstan
-
 Kenya
-
 Korea
-
 Kuwait
-
 Kyrgyzstan
-
 Laos
-
 Latvia
-
 Lebanon
-
 Lesotho
-
 Libya
-
 Lithuania
-
 Luxembourg
-
 Madagascar
-
 Malaysia
-
 Malta
-
 Mauritius
-
 Mexico
-
 Moldova
-
 Mongolia
-
 Montenegro
-
 Morocco
-
 Mozambique
-
 Myanmar
-
 Namibia
-
 Nepal
-
 Netherlands
-
 New Zealand
-
 Nigeria
-
 North Macedonia
-
 Norway
-
 Oman
-
 Pakistan
-
 Palestine
-
 Panama
-
 Papua New Guinea
-
 Paraguay
-
 Peru
-
 Philippines
-
 Poland
-
 Portugal
-
 Puerto Rico
-
 Qatar
-
 Reunion
-
 Romania
-
 Rwanda
-
 Saudi Arabia
-
 Serbia
-
 Singapore
-
 Slovakia
-
 Slovenia
-
 Somalia
-
 South Africa
-
 Spain
-
 Sri Lanka
-
 Sweden
-
 Switzerland
-
 Syria
-
 Taiwan
-
 Tajikistan
-
 Tanzania
-
 Thailand
-
 Trinidad and Tobago
-
 Tunisia
-
 Turkey
-
 UAE
-
 Uganda
-
 Ukraine
-
 United Kingdom
-
United States
-
 Uruguay
-
 Uzbekistan
-
 Venezuela
-
 Vietnam
-
 Yemen
-
 Zambia
-
 Zimbabwe
- Forex
- Crypto












