


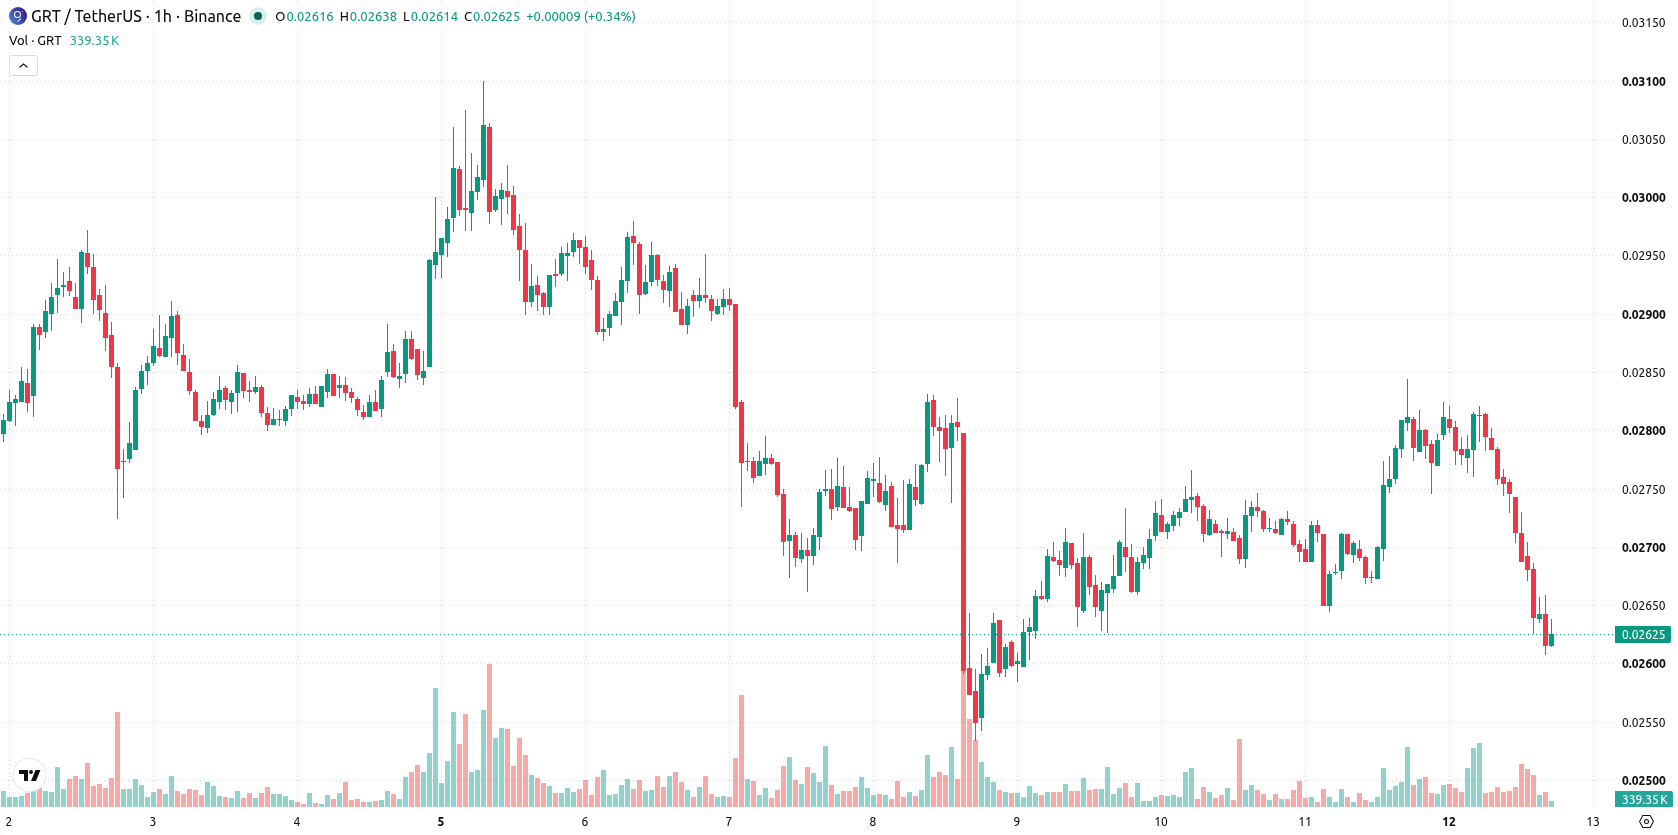
The Graph (GRT) is trading at $0.02635, down 7.09% over the last 24 hours. The asset currently sits below its key short- and medium-term moving averages, reflecting a broadly negative tone in intraday trading.
 0.02821
0.02980000
0.02821
0.02980000
Highlights
- GRT/USD trades below key short- and medium-term moving averages, indicating sustained downside momentum in the short term.
- Bearish momentum dominates as MACD signals sell and all momentum oscillators indicate the asset is oversold and stretched.
- Expected price range for the next 2 to 3 days is $0.02531 to $0.02734952, with a 78% chance of further declines unless resistance at $0.027345 is breached.
Bearish signals expand as resistance holds and oversold grows
On the hourly chart, GRT/USD is below both its MA-20 at $0.027502 and MA-50 at $0.0273442, while staying above the MA-200 at $0.0212141. The Ichimoku Kijun line is situated at $0.027345, serving as immediate resistance. Bearish momentum dominates, evidenced by MACD on a sell signal and the Awesome Oscillator confirming downside pressure; ADX remains neutral, but Bull/Bear Power continues to reflect seller dominance. Oversold signals are prominent, with RSI, Stochastic RSI, and CCI all indicating the asset is technically stretched.
Downside favored as volatility maintains tight trading range
Over the next 2–3 trading days, GRT is expected to fluctuate within the $0.02531 to $0.02734952 range, reflecting typical volatility conditions. The probability of a continued downward move is estimated at 78%, while a rebound has a lower likelihood at 22%. The baseline scenario points to price consolidating between support and resistance. A move above $0.027345 would open the way for a bullish scenario, while sustained trading below immediate support could trigger further declines.
Earlier, analysts noted that The Graph was under sustained selling pressure, but suggested that oversold technical conditions could set the stage for a potential rebound. The current analysis reinforces this cautious view, highlighting that persistent downside momentum still dominates and emphasizing the need to monitor whether support around $0.02531 can hold in the days ahead.











-
 Afghanistan
-
 Albania
-
 Algeria
-
 Angola
-
 Argentina
-
 Armenia
-
 Australia
-
 Austria
-
 Azerbaijan
-
 Bahamas
-
 Bahrain
-
 Bangladesh
-
 Belarus
-
 Belgium
-
 Bolivia
-
 Botswana
-
 Brazil
-
 Brunei
-
 Bulgaria
-
 Cambodia
-
 Cameroon
-
 Canada
-
 Chile
Chile
-
 China
China
-
 Colombia
-
 Congo
Congo
-
 Costa Rica
-
 Cote d'Ivoire
-
 Croatia
-
 Cuba
Cuba
-
 Cyprus
-
 Czechia
-
 DR Congo
-
 Denmark
-
 Dominican Republic
-
 Ecuador
-
 Egypt
Egypt
-
 El Salvador
-
 Estonia
-
 Eswatini
-
 Ethiopia
-
 Finland
-
 France
-
 Georgia
-
 Germany
-
 Ghana
Ghana
-
 Greece
-
 Haiti
Haiti
-
 Hong Kong
-
 Hungary
-
 India
India
-
 Indonesia
-
 Iran, Islamic republic
-
 Iraq
Iraq
-
 Ireland
-
 Israel
-
 Italy
Italy
-
 Jamaica
-
 Japan
Japan
-
 Jordan
-
 Kazakhstan
-
 Kenya
Kenya
-
 Korea
Korea
-
 Kuwait
-
 Kyrgyzstan
-
 Laos
Laos
-
 Latvia
-
 Lebanon
-
 Lesotho
-
 Libya
Libya
-
 Lithuania
-
 Luxembourg
-
 Madagascar
-
 Malaysia
-
 Malta
Malta
-
 Mauritius
-
 Mexico
-
 Moldova
-
 Mongolia
-
 Montenegro
-
 Morocco
-
 Mozambique
-
 Myanmar
-
 Namibia
-
 Nepal
Nepal
-
 Netherlands
-
 New Zealand
-
 Nigeria
-
 North Macedonia
-
 Norway
-
 Oman
Oman
-
 Pakistan
-
 Palestine
-
 Panama
-
 Papua New Guinea
-
 Paraguay
-
 Peru
Peru
-
 Philippines
-
 Poland
-
 Portugal
-
 Puerto Rico
-
 Qatar
Qatar
-
 Reunion
-
 Romania
-
 Rwanda
-
 Saudi Arabia
-
 Serbia
-
 Singapore
-
 Slovakia
-
 Slovenia
-
 Somalia
-
 South Africa
-
 Spain
Spain
-
 Sri Lanka
-
 Sweden
-
 Switzerland
-
 Syria
Syria
-
 Taiwan
-
 Tajikistan
-
 Tanzania
-
 Thailand
-
 Trinidad and Tobago
-
 Tunisia
-
 Turkey
-
 UAE
UAE
-
 Uganda
-
 Ukraine
-
 United Kingdom
-
United States
-
 Uruguay
-
 Uzbekistan
-
 Venezuela
-
 Vietnam
-
 Yemen
Yemen
-
 Zambia
-
 Zimbabwe
- Forex
- Crypto












