

Nexo consolidates below $0.8433 resistance with bearish risks prevailing: weekly analysis

Nexo (NEXO) sits near $0.84 after dropping around 1% over the past week, with sellers keeping the setup deep in oversold territory. The price action reflects mixed momentum signals and continued uncertainty in the technical outlook, highlighting an ongoing tug-of-war between consolidation and a potential new directional move. The week ahead will likely turn on whether this narrow, volatile pattern resolves into a breakout or deeper retracement.
 0.841
0.8560
0.841
0.8560
Highlights
- Nexo trades below both short-term moving averages and is down 1.3% over the past week, showing a flat-to-weak structure.
- The price is consolidating within a tight range, with neutral RSI and Stochastic RSI indicating possible short-term uncertainty.
- Nexo is projected to trade between $0.8152 and $0.8607 next week, with resistance at $0.8433 and support at $0.8213.
Rangebound trade persists as mixed signals stall breakout momentum
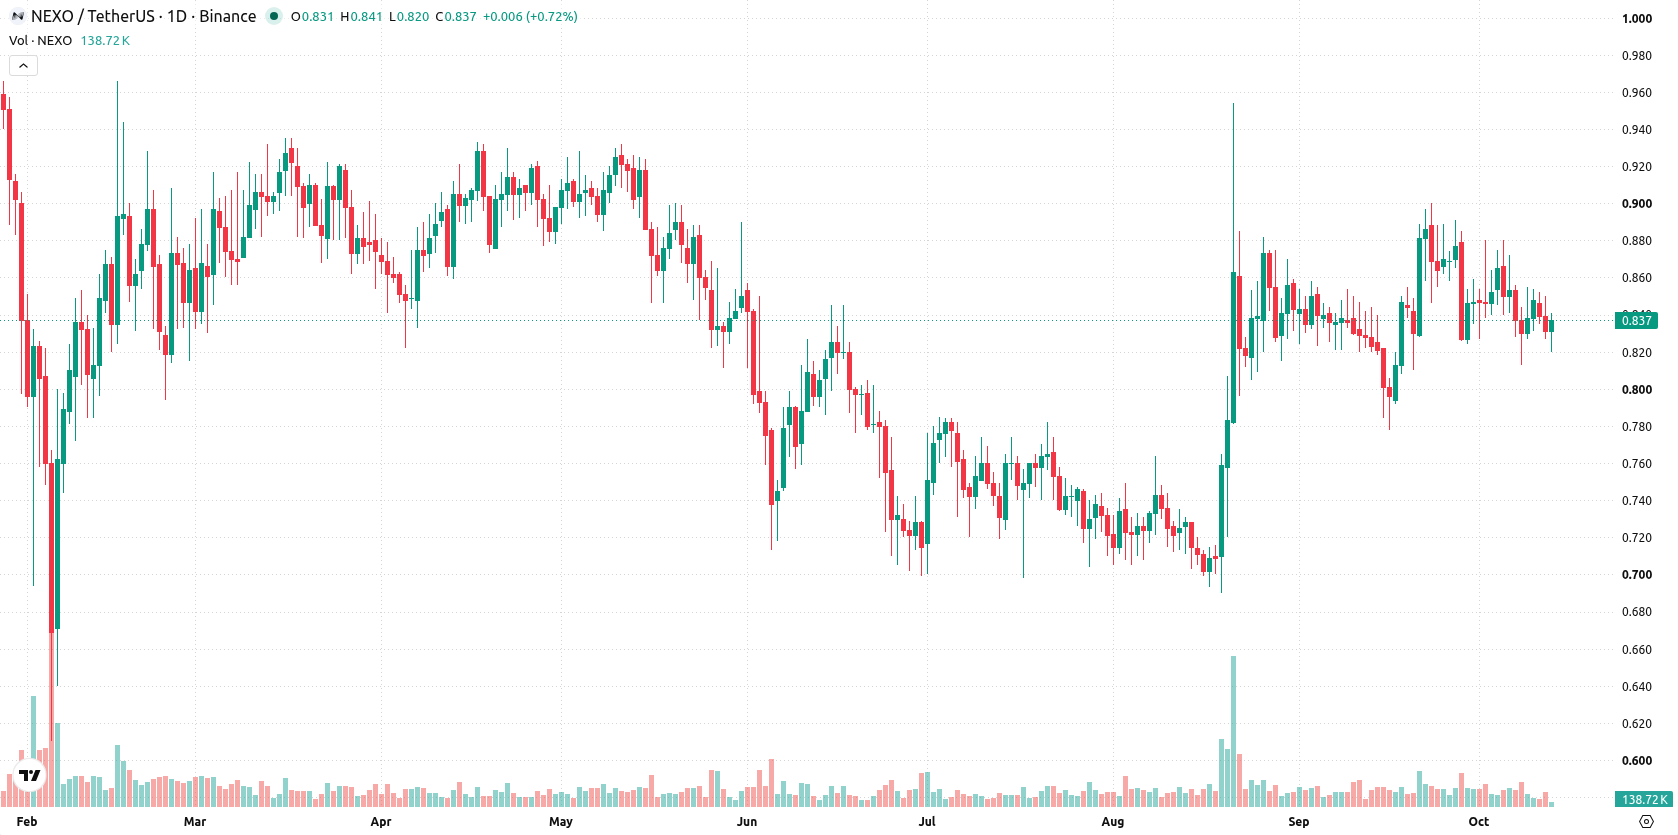
The daily chart shows Nexo caught in a contained move within a narrow range, with volatility sitting at 5.29%. Momentum signals are mixed: the RSI is neutral at 47.3546, while the Stochastic RSI is in the oversold zone, pointing to short-term uncertainty. Immediate resistance is marked by the MA-50 at $0.8433 and the Ichimoku Kijun at $0.846, while nearest support stands at the MA-200 at $0.8213. This combination suggests that consolidation is dominating and a clear breakout could define the next directional move.
Breakout risk looms as next week’s bias hinges on support or resistance
Over the coming week, Nexo is expected to trade between $0.8152 and $0.8607, with a 40% probability of an increase and a 60% probability of a decrease. The base case is continued rangebound trading within these boundaries, reflecting the flat momentum and mixed signals. A push above $0.8433 resistance would shift momentum positive. A drop below the $0.8213 support would expose the lower end of the forecast range and favor bears.
Previously it was reported that Nexo expanded its platform's offerings by adding support for Zcash (ZEC). As the technical picture for Nexo now hinges on a potential breakout or breakdown from its current narrow range, traders should monitor for a decisive close beyond immediate support or resistance to gauge the next significant move.





Latest Nexo News



-
 Afghanistan
-
 Albania
-
 Algeria
-
 Angola
-
 Argentina
-
 Armenia
-
 Australia
-
 Austria
-
 Azerbaijan
-
 Bahamas
-
 Bahrain
-
 Bangladesh
-
 Belarus
-
 Belgium
-
 Bolivia
-
 Botswana
-
 Brazil
-
 Brunei
-
 Bulgaria
-
 Cambodia
-
 Cameroon
-
 Canada
-
 Chile
Chile
-
 China
China
-
 Colombia
-
 Congo
Congo
-
 Costa Rica
-
 Cote d'Ivoire
-
 Croatia
-
 Cuba
Cuba
-
 Cyprus
-
 Czechia
-
 DR Congo
-
 Denmark
-
 Dominican Republic
-
 Ecuador
-
 Egypt
Egypt
-
 El Salvador
-
 Estonia
-
 Eswatini
-
 Ethiopia
-
 Finland
-
 France
-
 Georgia
-
 Germany
-
 Ghana
Ghana
-
 Greece
-
 Haiti
Haiti
-
 Hong Kong
-
 Hungary
-
 India
India
-
 Indonesia
-
 Iran, Islamic republic
-
 Iraq
Iraq
-
 Ireland
-
 Israel
-
 Italy
Italy
-
 Jamaica
-
 Japan
Japan
-
 Jordan
-
 Kazakhstan
-
 Kenya
Kenya
-
 Korea
Korea
-
 Kuwait
-
 Kyrgyzstan
-
 Laos
Laos
-
 Latvia
-
 Lebanon
-
 Lesotho
-
 Libya
Libya
-
 Lithuania
-
 Luxembourg
-
 Madagascar
-
 Malaysia
-
 Malta
Malta
-
 Mauritius
-
 Mexico
-
 Moldova
-
 Mongolia
-
 Montenegro
-
 Morocco
-
 Mozambique
-
 Myanmar
-
 Namibia
-
 Nepal
Nepal
-
 Netherlands
-
 New Zealand
-
 Nigeria
-
 North Macedonia
-
 Norway
-
 Oman
Oman
-
 Pakistan
-
 Palestine
-
 Panama
-
 Papua New Guinea
-
 Paraguay
-
 Peru
Peru
-
 Philippines
-
 Poland
-
 Portugal
-
 Puerto Rico
-
 Qatar
Qatar
-
 Reunion
-
 Romania
-
 Rwanda
-
 Saudi Arabia
-
 Serbia
-
 Singapore
-
 Slovakia
-
 Slovenia
-
 Somalia
-
 South Africa
-
 Spain
Spain
-
 Sri Lanka
-
 Sweden
-
 Switzerland
-
 Syria
Syria
-
 Taiwan
-
 Tajikistan
-
 Tanzania
-
 Thailand
-
 Trinidad and Tobago
-
 Tunisia
-
 Turkey
-
 UAE
UAE
-
 Uganda
-
 Ukraine
-
 United Kingdom
-
United States
-
 Uruguay
-
 Uzbekistan
-
 Venezuela
-
 Vietnam
-
 Yemen
Yemen
-
 Zambia
-
 Zimbabwe
- Forex
- Crypto












