

BTC moves sideways as bullish momentum conflicts with overbought technical signals

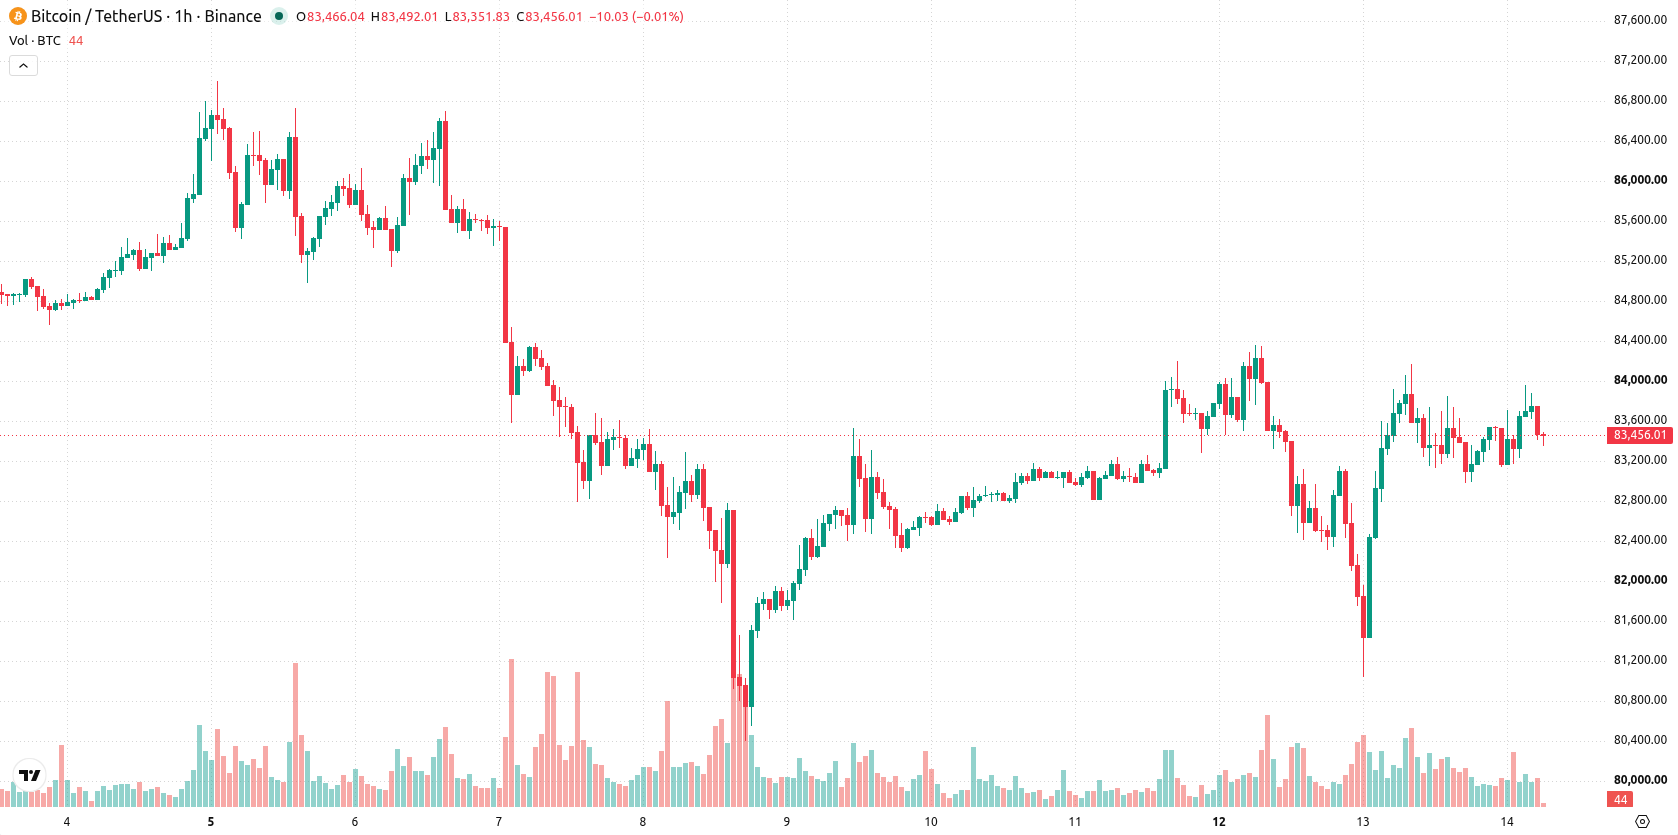
Bitcoin (BTC) is trading at $83,466 after a modest loss on the day. The price holds above its key moving averages across both hourly and daily timeframes.
 83958
84352.00
83958
84352.00
Highlights
- Strive acquired 3,311 Bitcoin for $280 million, increasing its institutional holdings to 32,773 BTC during early October 2026.
- A London High Court ruling applied Chinese law to over 61,000 seized Bitcoin, introducing legal uncertainty for future asset flows.
- BTC/USD shows a bullish structure with persistent upside momentum, expected to trade between $81,229 and $84,351 over the next several days.
Institutional accumulation and legal uncertainty drive sentiment shifts
Strive (Nasdaq: ASST) acquired 3,311 Bitcoin for approximately $280 million between October 5 and 9, 2026, raising its total holdings to 32,773 BTC and contributing to institutional demand in the market, according to filings and company statements reported by Bitbase. Additional buying came from Strategy, which purchased 250 Bitcoin for $21.5 million, marginally increasing its overall exposure and adding background support for sentiment, according to Tipranks. Meanwhile, a London High Court ruling on October 12, 2026 decided jurisdiction over more than 61,000 seized Bitcoin under Chinese law, as reported by Tokenpost, creating legal uncertainty over future asset flows.
Bullish momentum diverges from overbought signals across key levels
On the technical front, BTC/USD is situated above its MA-20 and MA-50 on the hourly chart and above the MA-200 on the daily timeframe, indicating positive structure across both timeframes. The Ichimoku Kijun at $83,475 is the nearest resistance, while key support is located near $81,229. MACD signals continued bullish momentum and the Awesome Oscillator aligns with the upside bias. However, RSI shows a mild buy bias and Stoch RSI, CCI, and Bull/Bear Power all point to overbought conditions intraday. ADX remains neutral, indicating the current trend is not strongly established. This divergence between bullish momentum and overbought indicators suggests that a pause or pullback could develop.
Range-bound outlook as breakout and support risks emerge
Over the next 2–3 days, BTC/USD is likely to hold within a volatility band between $81,229 and $84,351. The baseline scenario projects sideways movement within this corridor, with a very high probability of maintaining range-bound price action. A breakout above $83,475 would tilt the scenario toward a renewed bullish phase, while any failure of support at $81,229 could open the door for a deeper pullback.
Previously it was reported that the London High Court ruled claims to over 61,000 seized Bitcoin would be assessed under Chinese law, introducing legal uncertainty over the future status of these assets. Against this backdrop, traders should closely monitor the $83,475 level for a potential breakout, as sustained moves above or below this point may signal the next directional shift.





Latest Bitcoin News






-
 Afghanistan
-
 Albania
-
 Algeria
-
 Angola
-
 Argentina
-
 Armenia
-
 Australia
-
 Austria
-
 Azerbaijan
-
 Bahamas
-
 Bahrain
-
 Bangladesh
-
 Belarus
-
 Belgium
-
 Bolivia
-
 Botswana
-
 Brazil
-
 Brunei
-
 Bulgaria
-
 Cambodia
-
 Cameroon
-
 Canada
-
 Chile
Chile
-
 China
China
-
 Colombia
-
 Congo
Congo
-
 Costa Rica
-
 Cote d'Ivoire
-
 Croatia
-
 Cuba
Cuba
-
 Cyprus
-
 Czechia
-
 DR Congo
-
 Denmark
-
 Dominican Republic
-
 Ecuador
-
 Egypt
Egypt
-
 El Salvador
-
 Estonia
-
 Eswatini
-
 Ethiopia
-
 Finland
-
 France
-
 Georgia
-
 Germany
-
 Ghana
Ghana
-
 Greece
-
 Haiti
Haiti
-
 Hong Kong
-
 Hungary
-
 India
India
-
 Indonesia
-
 Iran, Islamic republic
-
 Iraq
Iraq
-
 Ireland
-
 Israel
-
 Italy
Italy
-
 Jamaica
-
 Japan
Japan
-
 Jordan
-
 Kazakhstan
-
 Kenya
Kenya
-
 Korea
Korea
-
 Kuwait
-
 Kyrgyzstan
-
 Laos
Laos
-
 Latvia
-
 Lebanon
-
 Lesotho
-
 Libya
Libya
-
 Lithuania
-
 Luxembourg
-
 Madagascar
-
 Malaysia
-
 Malta
Malta
-
 Mauritius
-
 Mexico
-
 Moldova
-
 Mongolia
-
 Montenegro
-
 Morocco
-
 Mozambique
-
 Myanmar
-
 Namibia
-
 Nepal
Nepal
-
 Netherlands
-
 New Zealand
-
 Nigeria
-
 North Macedonia
-
 Norway
-
 Oman
Oman
-
 Pakistan
-
 Palestine
-
 Panama
-
 Papua New Guinea
-
 Paraguay
-
 Peru
Peru
-
 Philippines
-
 Poland
-
 Portugal
-
 Puerto Rico
-
 Qatar
Qatar
-
 Reunion
-
 Romania
-
 Rwanda
-
 Saudi Arabia
-
 Serbia
-
 Singapore
-
 Slovakia
-
 Slovenia
-
 Somalia
-
 South Africa
-
 Spain
Spain
-
 Sri Lanka
-
 Sweden
-
 Switzerland
-
 Syria
Syria
-
 Taiwan
-
 Tajikistan
-
 Tanzania
-
 Thailand
-
 Trinidad and Tobago
-
 Tunisia
-
 Turkey
-
 UAE
UAE
-
 Uganda
-
 Ukraine
-
 United Kingdom
-
United States
-
 Uruguay
-
 Uzbekistan
-
 Venezuela
-
 Vietnam
-
 Yemen
Yemen
-
 Zambia
-
 Zimbabwe
- Forex
- Crypto












