

Will Bitcoin hold $61,784 support amid ongoing ETF outflows and bearish technicals?

Bitcoin (BTC) is trading at $64,530, marking a daily decline of 4.11%. The asset currently remains below its key moving averages, reflecting near-term and longer-term technical pressure.
 65595.77
75599.22
Highlights
- U.S. spot bitcoin ETFs saw $1.07 billion in net outflows last week, extending a multiweek institutional selloff.
- Crypto ETFs experienced $1.53 billion in outflows between November 9 and 13, with most withdrawals from bitcoin funds and demand remaining weak.
- BTC/USD trades below key moving averages, with short- and long-term trends bearish and a projected range of $61,784 to $67,276 over the next 2 to 3 days.
Heavy ETF outflows exacerbate institutional sell pressure on bitcoin
U.S. spot bitcoin ETFs recorded $1.07 billion in net outflows last week, the second consecutive week of withdrawals above $1 billion, according to The Block. This large-scale redemption activity reflects significant institutional selling, as ETF liquidations require underlying Bitcoin to be sold, applying direct pressure to the market. Additional data from Crypto confirmed that Crypto ETFs lost a combined $1.53 billion between November 9 and 13, with Bitcoin funds accounting for the bulk of these outflows and compounding the weaker demand backdrop.
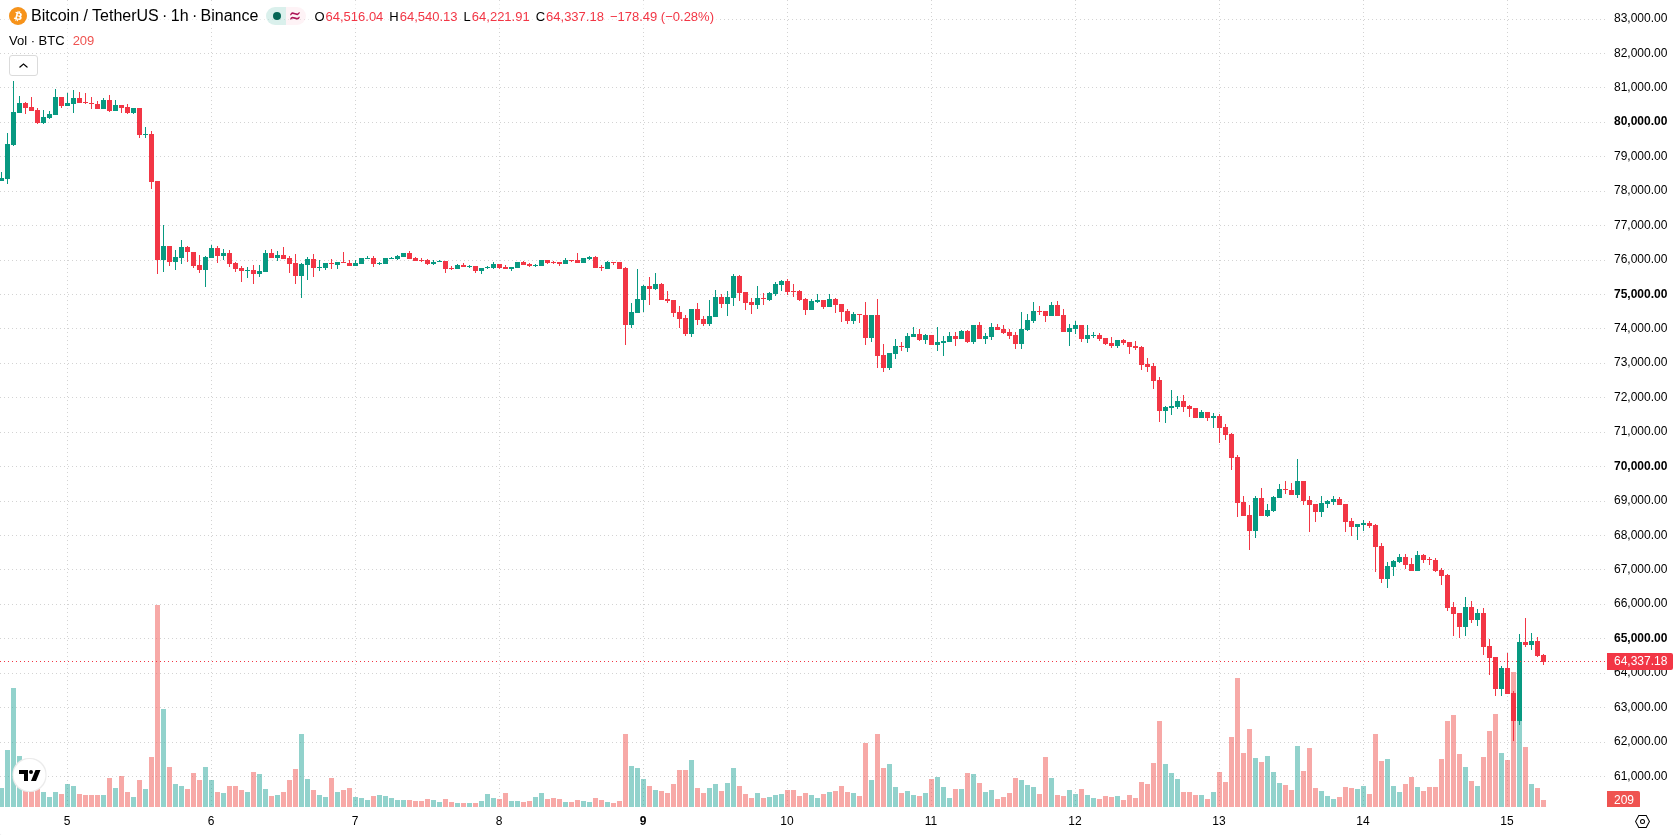
Immediate resistance holds as selling momentum coexists with neutral signals
On the hourly timeframe, BTC is positioned below the MA-20, MA-50, and MA-200, with immediate resistance marked by the Ichimoku Kijun at $64,882. Momentum indicators are mixed: MACD signals strong selling pressure and ADX confirms a sell trigger, while RSI and CCI remain neutral. Stoch RSI is in the overbought zone, hinting at possible short-term overheating, and Bull/Bear Power is positive, indicating some intraday buying interest. Awesome Oscillator shows a neutral reading, underscoring the lack of a confirmed reversal.
Sideways bias prevails as downside risk outweighs limited upside
In the short term, BTC is expected to trade within the $61,784 to $67,276 volatility band. Downward movement remains more probable, with a 75% likelihood based on current technical and market signals. Although limited upside cannot be excluded, any bullish scenario would require a clear breakout above immediate resistance, while further declines may be triggered if price falls below nearby support. The base case is for a sideways trading corridor over the next 2–3 sessions.
Earlier, analysts noted that persistent outflows from U.S. spot Bitcoin ETFs and ongoing technical weakness were driving a sustained bearish trend in Bitcoin. The latest data underscores and amplifies this pressure, with continued major ETF redemptions intensifying downside risk and highlighting the importance of monitoring the $61,784 support for any potential further declines.










-
 Afghanistan
-
 Albania
-
 Algeria
-
 Angola
-
 Argentina
-
 Armenia
-
 Australia
-
 Austria
-
 Azerbaijan
-
 Bahamas
-
 Bahrain
-
 Bangladesh
-
 Belarus
-
 Belgium
-
 Bolivia
-
 Botswana
-
 Brazil
-
 Brunei
-
 Bulgaria
-
 Cambodia
-
 Cameroon
-
 Canada
-
 Chile
-
 China
-
 Colombia
-
 Congo
-
 Costa Rica
-
 Cote d'Ivoire
-
 Croatia
-
 Cuba
-
 Cyprus
-
 Czechia
-
 DR Congo
-
 Denmark
-
 Dominican Republic
-
 Ecuador
-
 Egypt
-
 El Salvador
-
 Estonia
-
 Eswatini
-
 Ethiopia
-
 Finland
-
 France
-
 Georgia
-
 Germany
-
 Ghana
-
 Greece
-
 Haiti
-
 Hong Kong
-
 Hungary
-
 India
-
 Indonesia
-
 Iran, Islamic republic
-
 Iraq
-
 Ireland
-
 Israel
-
 Italy
-
 Jamaica
-
 Japan
-
 Jordan
-
 Kazakhstan
-
 Kenya
-
 Korea
-
 Kuwait
-
 Kyrgyzstan
-
 Laos
-
 Latvia
-
 Lebanon
-
 Lesotho
-
 Libya
-
 Lithuania
-
 Luxembourg
-
 Madagascar
-
 Malaysia
-
 Malta
-
 Mauritius
-
 Mexico
-
 Moldova
-
 Mongolia
-
 Montenegro
-
 Morocco
-
 Mozambique
-
 Myanmar
-
 Namibia
-
 Nepal
-
 Netherlands
-
 New Zealand
-
 Nigeria
-
 North Macedonia
-
 Norway
-
 Oman
-
 Pakistan
-
 Palestine
-
 Panama
-
 Papua New Guinea
-
 Paraguay
-
 Peru
-
 Philippines
-
 Poland
-
 Portugal
-
 Puerto Rico
-
 Qatar
-
 Reunion
-
 Romania
-
 Rwanda
-
 Saudi Arabia
-
 Serbia
-
 Singapore
-
 Slovakia
-
 Slovenia
-
 Somalia
-
 South Africa
-
 Spain
-
 Sri Lanka
-
 Sweden
-
 Switzerland
-
 Syria
-
 Taiwan
-
 Tajikistan
-
 Tanzania
-
 Thailand
-
 Trinidad and Tobago
-
 Tunisia
-
 Turkey
-
 UAE
-
 Uganda
-
 Ukraine
-
 United Kingdom
-
United States
-
 Uruguay
-
 Uzbekistan
-
 Venezuela
-
 Vietnam
-
 Yemen
-
 Zambia
-
 Zimbabwe
- Forex
- Crypto












