

The Graph declines as seller pressure accelerates downward price move

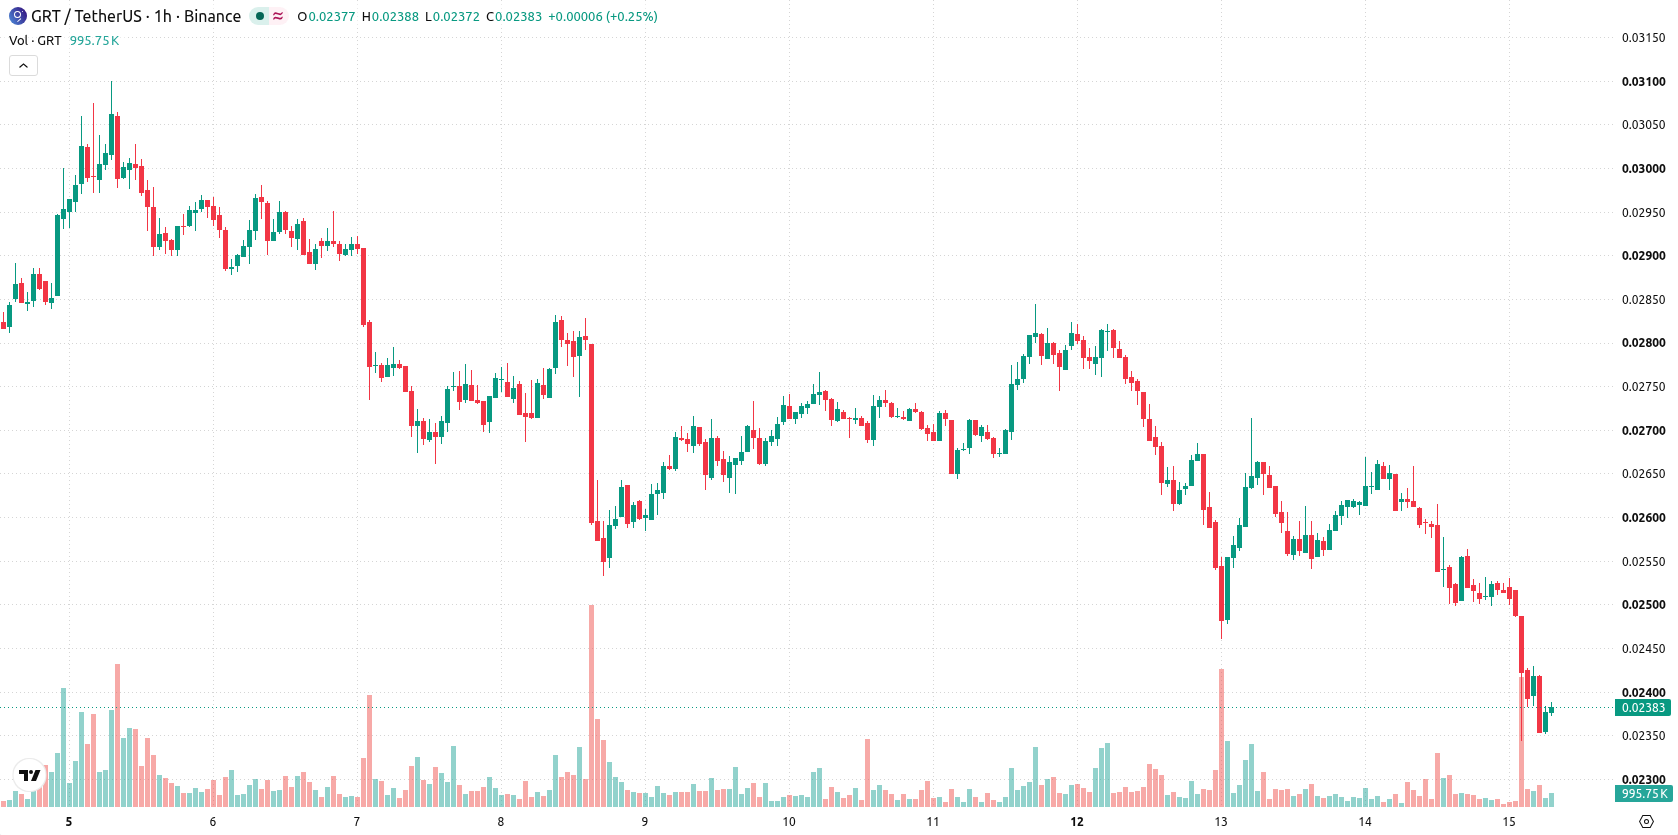
The Graph (GRT) is trading at $0.02379 after a steep drop of 9.3% on the day, closing near its intraday low. The asset now sits below its key moving averages.
 0.02027
0.02314000
Highlights
- GRT/USD fell sharply by 9.3% to $0.02379 and closed near the intraday low as selling pressure dominated.
- The asset trades below short- and medium-term moving averages, with technical indicators confirming strong downside momentum and oversold conditions.
- Price is expected to fluctuate between $0.02284 and $0.02464865 over the next 2 to 3 days, with a high probability of further downside.
Negative momentum intensifies as technical barriers reinforce bearish tone
On the hourly chart, GRT is trading below the MA-20 ($0.024903) and MA-50 ($0.0256196), while remaining above the MA-200 ($0.021239) on the daily. The Ichimoku Kijun is positioned at $0.02501, creating immediate resistance. Momentum indicators present a decisively negative setup: both MACD and ADX signal strong downside pressure, and RSI at 27.44 flashes an oversold sell signal, which is further confirmed by CCI and Bull/Bear Power readings that highlight continued seller dominance. Stochastic RSI, however, provides a strong buy signal, suggesting possible divergence under extreme oversold conditions, while Awesome Oscillator remains aligned with the prevailing bearish trend. Elevated volatility and GRT’s close near its intraday low reinforce the current negative tone.
Limited upside potential as downside risk dominates short-term range
Over the coming 2 to 3 trading days, GRT is expected to fluctuate within a range of $0.02284 to $0.02464865. The probability of an upward price movement is very low, with downside risk dominating the short-term outlook. Should resistance at $0.02501 be breached decisively, a rebound could unfold, but if support at $0.02284 fails, further selling and fresh lows are likely.
Earlier, analysts noted that The Graph was under sustained selling pressure but highlighted the potential for a rebound if oversold conditions persisted. The current analysis reinforces this view by showing renewed downside momentum and emphasizes that traders should closely monitor whether support at $0.02284 can hold, as a break below could expose GRT to additional declines.











-
 Afghanistan
-
 Albania
-
 Algeria
-
 Angola
-
 Argentina
-
 Armenia
-
 Australia
-
 Austria
-
 Azerbaijan
-
 Bahamas
-
 Bahrain
-
 Bangladesh
-
 Belarus
-
 Belgium
-
 Bolivia
-
 Botswana
-
 Brazil
-
 Brunei
-
 Bulgaria
-
 Cambodia
-
 Cameroon
-
 Canada
-
 Chile
-
 China
-
 Colombia
-
 Congo
-
 Costa Rica
-
 Cote d'Ivoire
-
 Croatia
-
 Cuba
-
 Cyprus
-
 Czechia
-
 DR Congo
-
 Denmark
-
 Dominican Republic
-
 Ecuador
-
 Egypt
-
 El Salvador
-
 Estonia
-
 Eswatini
-
 Ethiopia
-
 Finland
-
 France
-
 Georgia
-
 Germany
-
 Ghana
-
 Greece
-
 Haiti
-
 Hong Kong
-
 Hungary
-
 India
-
 Indonesia
-
 Iran, Islamic republic
-
 Iraq
-
 Ireland
-
 Israel
-
 Italy
-
 Jamaica
-
 Japan
-
 Jordan
-
 Kazakhstan
-
 Kenya
-
 Korea
-
 Kuwait
-
 Kyrgyzstan
-
 Laos
-
 Latvia
-
 Lebanon
-
 Lesotho
-
 Libya
-
 Lithuania
-
 Luxembourg
-
 Madagascar
-
 Malaysia
-
 Malta
-
 Mauritius
-
 Mexico
-
 Moldova
-
 Mongolia
-
 Montenegro
-
 Morocco
-
 Mozambique
-
 Myanmar
-
 Namibia
-
 Nepal
-
 Netherlands
-
 New Zealand
-
 Nigeria
-
 North Macedonia
-
 Norway
-
 Oman
-
 Pakistan
-
 Palestine
-
 Panama
-
 Papua New Guinea
-
 Paraguay
-
 Peru
-
 Philippines
-
 Poland
-
 Portugal
-
 Puerto Rico
-
 Qatar
-
 Reunion
-
 Romania
-
 Rwanda
-
 Saudi Arabia
-
 Serbia
-
 Singapore
-
 Slovakia
-
 Slovenia
-
 Somalia
-
 South Africa
-
 Spain
-
 Sri Lanka
-
 Sweden
-
 Switzerland
-
 Syria
-
 Taiwan
-
 Tajikistan
-
 Tanzania
-
 Thailand
-
 Trinidad and Tobago
-
 Tunisia
-
 Turkey
-
 UAE
-
 Uganda
-
 Ukraine
-
 United Kingdom
-
United States
-
 Uruguay
-
 Uzbekistan
-
 Venezuela
-
 Vietnam
-
 Yemen
-
 Zambia
-
 Zimbabwe
- Forex
- Crypto












