

Sei declines amid strong selling momentum and limited upside potential

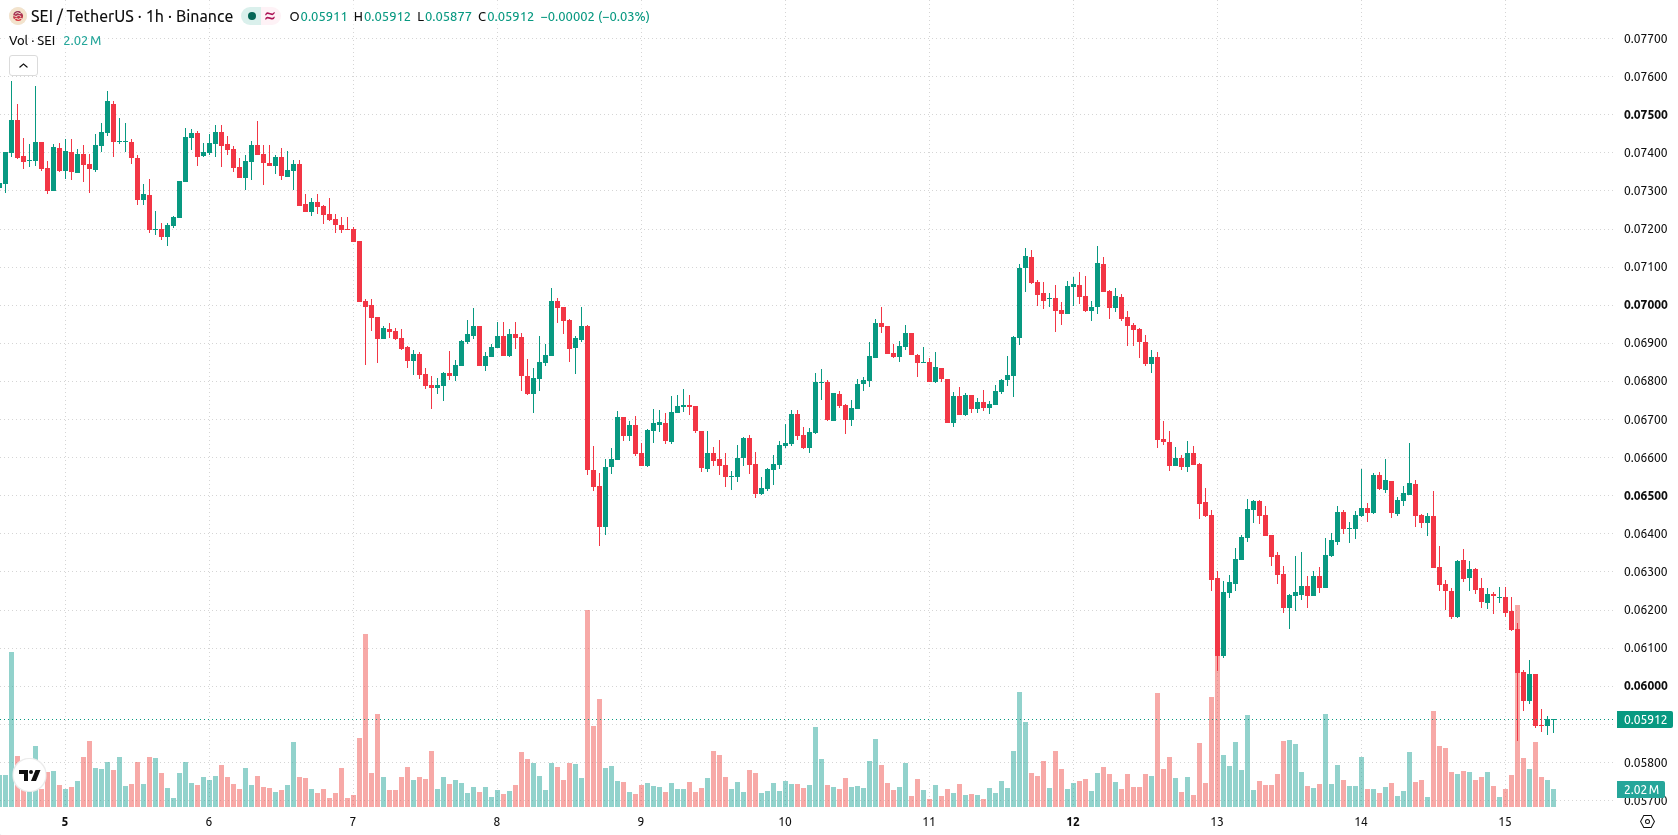
Sei (SEI) is trading at $0.059 after a sharp daily decline of 10.51%. The asset remains below its key moving averages.
 0.049
0.0545
Highlights
- SEI trades below key short- and medium-term moving averages, with sustained selling pressure and no bullish divergence among indicators.
- Momentum remains bearish with MACD, ADX, and other oscillators in oversold territory, confirming strong dominance by sellers.
- Expected price range for coming sessions is $0.0563 to $0.0615, with high probability of continued downside unless resistance at $0.0625 is broken.
Bearish momentum hardens as oversold readings and resistance converge
On the H1 chart, SEI/USD is trading below both the MA-20 ($0.0616) and MA-50 ($0.063), while price remains above the MA-200 ($0.0541) level on the daily timeframe. The Ichimoku Kijun provides immediate resistance at $0.0625. Short-term momentum stays bearish, with both MACD and ADX confirming the current downtrend. Indicators including RSI (26.5), Stochastic RSI, and CCI are all registering oversold readings. Bull/Bear Power signals strong seller dominance, and the Awesome Oscillator is aligned with this bearish momentum. Price action is hovering near the daily low, and there is no notable divergence visible among momentum indicators.
Further downside risk persists as price remains in lower band
For the coming sessions, SEI is expected to trade within a volatility band between $0.0563 and $0.0615. The probability of a further decline remains high, while the chance of a meaningful upward move is considered low. If SEI can break above $0.0625, a bullish scenario may begin to unfold; however, a drop below $0.0563 would renew downside risk. The baseline scenario calls for sideways movement within the identified range.
Earlier, analysts noted that Sei was experiencing mixed momentum signals, with the medium- and long-term outlook appearing more resilient despite short-term weakness. The current analysis strengthens the bearish case for the near term, highlighting that a sustained move below $0.0563 would raise the risk of accelerated downside.










-
 Afghanistan
-
 Albania
-
 Algeria
-
 Angola
-
 Argentina
-
 Armenia
-
 Australia
-
 Austria
-
 Azerbaijan
-
 Bahamas
-
 Bahrain
-
 Bangladesh
-
 Belarus
-
 Belgium
-
 Bolivia
-
 Botswana
-
 Brazil
-
 Brunei
-
 Bulgaria
-
 Cambodia
-
 Cameroon
-
 Canada
-
 Chile
-
 China
-
 Colombia
-
 Congo
-
 Costa Rica
-
 Cote d'Ivoire
-
 Croatia
-
 Cuba
-
 Cyprus
-
 Czechia
-
 DR Congo
-
 Denmark
-
 Dominican Republic
-
 Ecuador
-
 Egypt
-
 El Salvador
-
 Estonia
-
 Eswatini
-
 Ethiopia
-
 Finland
-
 France
-
 Georgia
-
 Germany
-
 Ghana
-
 Greece
-
 Haiti
-
 Hong Kong
-
 Hungary
-
 India
-
 Indonesia
-
 Iran, Islamic republic
-
 Iraq
-
 Ireland
-
 Israel
-
 Italy
-
 Jamaica
-
 Japan
-
 Jordan
-
 Kazakhstan
-
 Kenya
-
 Korea
-
 Kuwait
-
 Kyrgyzstan
-
 Laos
-
 Latvia
-
 Lebanon
-
 Lesotho
-
 Libya
-
 Lithuania
-
 Luxembourg
-
 Madagascar
-
 Malaysia
-
 Malta
-
 Mauritius
-
 Mexico
-
 Moldova
-
 Mongolia
-
 Montenegro
-
 Morocco
-
 Mozambique
-
 Myanmar
-
 Namibia
-
 Nepal
-
 Netherlands
-
 New Zealand
-
 Nigeria
-
 North Macedonia
-
 Norway
-
 Oman
-
 Pakistan
-
 Palestine
-
 Panama
-
 Papua New Guinea
-
 Paraguay
-
 Peru
-
 Philippines
-
 Poland
-
 Portugal
-
 Puerto Rico
-
 Qatar
-
 Reunion
-
 Romania
-
 Rwanda
-
 Saudi Arabia
-
 Serbia
-
 Singapore
-
 Slovakia
-
 Slovenia
-
 Somalia
-
 South Africa
-
 Spain
-
 Sri Lanka
-
 Sweden
-
 Switzerland
-
 Syria
-
 Taiwan
-
 Tajikistan
-
 Tanzania
-
 Thailand
-
 Trinidad and Tobago
-
 Tunisia
-
 Turkey
-
 UAE
-
 Uganda
-
 Ukraine
-
 United Kingdom
-
United States
-
 Uruguay
-
 Uzbekistan
-
 Venezuela
-
 Vietnam
-
 Yemen
-
 Zambia
-
 Zimbabwe
- Forex
- Crypto












