

Will Flow stabilize above $0.0278 support amid continued seller dominance?

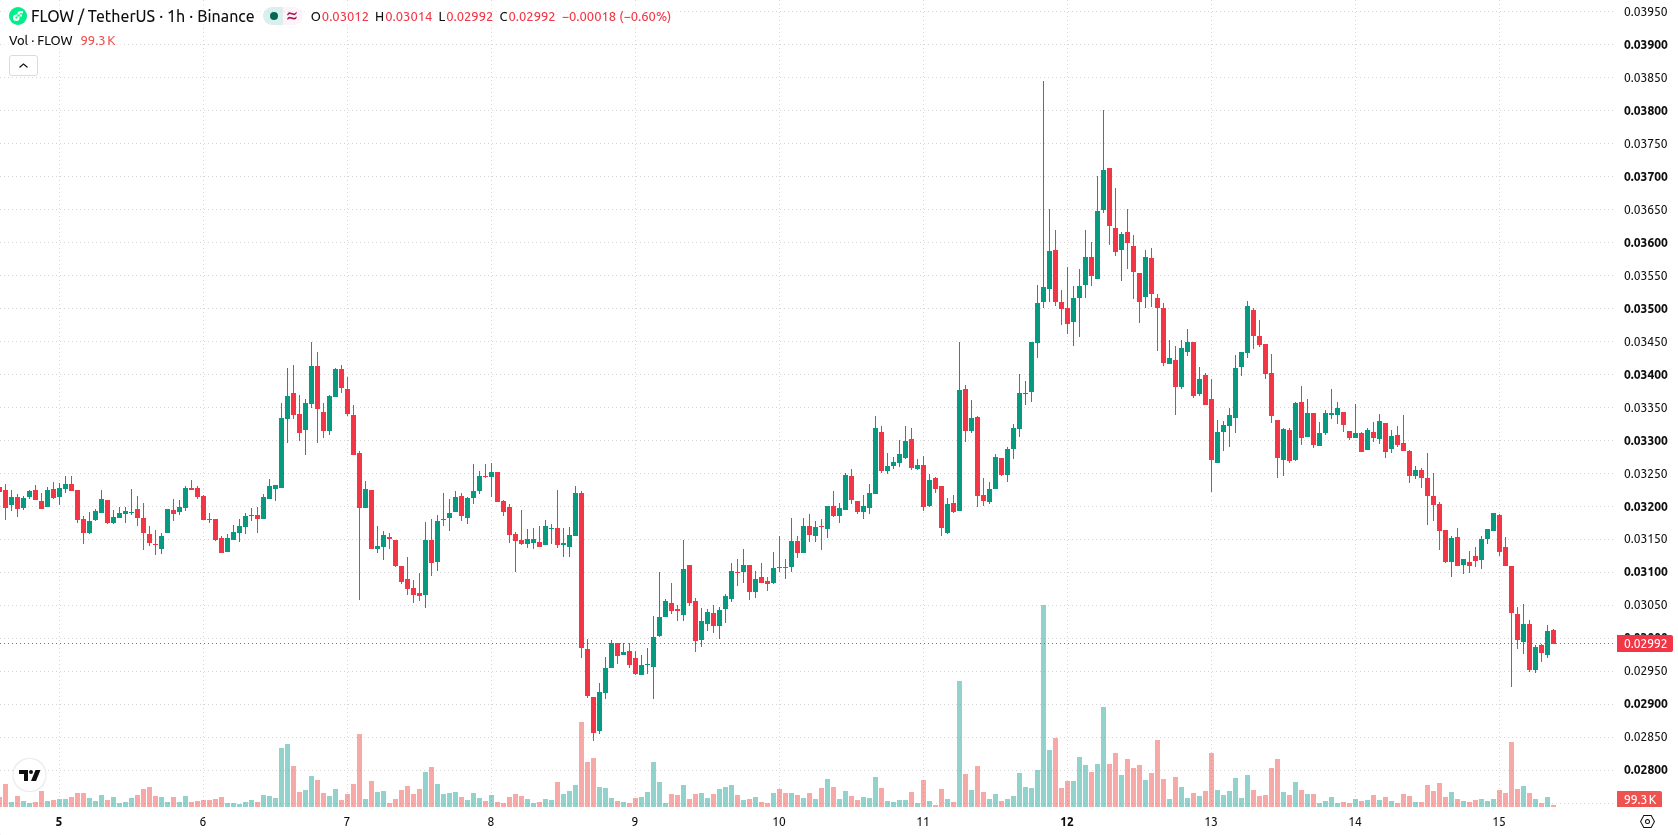
Flow (FLOW) is trading at $0.0299, down 8.38% on the day. The asset is currently positioned below its key moving averages across both hourly and daily timeframes.
 0.0324
0.0385
0.0324
0.0385
Highlights
- FLOW/USD trades below key moving averages on both hourly and daily charts, showing a persistent bearish structure.
- Momentum indicators are firmly bearish with oversold readings and sellers dominating intra-day, aligning with aggressive downside activity.
- The expected trading range over the next 2 to 3 days is $0.0278 to $0.032 with a very high probability of continued downside unless $0.0313 is reclaimed.
Bearish momentum intensifies as resistance holds and indicators weaken
On the technical front, FLOW remains below the MA-20 at $0.0309 and MA-50 at $0.0322 on the hourly chart, with the daily close also under the MA-200 at $0.0311. Immediate resistance is defined by the Ichimoku Kijun at $0.0313, while near-term support sits at $0.0278. Momentum indicators are bearish: MACD, ADX, and Stoch RSI all produce sell signals, while RSI at 30.763 and CCI point to oversold conditions. Bull/Bear Power confirms continued seller dominance intraday, in line with strong downside momentum. The Awesome Oscillator is neutral and does not provide an additional bias.
Downside continuation likely as reversal risks remain subdued
Over the next 2–3 days, FLOW is expected to trade within a typical volatility band of $0.0278 to $0.032. The risk of an upside reversal remains very low, while the probability of continued downside action is high. The base scenario anticipates price stabilization inside this range. A move above the $0.0313 Kijun resistance would open the door to a bullish scenario, while a sustained break below $0.0278 would confirm further bearish extension.
Earlier, analysts noted that Flow faced sustained technical weakness and ongoing downside pressure. The latest analysis reinforces this bearish outlook, with persistent negative momentum suggesting traders should closely monitor for a potential breakdown below $0.0278 as the next key risk.










-
 Afghanistan
-
 Albania
-
 Algeria
-
 Angola
-
 Argentina
-
 Armenia
-
 Australia
-
 Austria
-
 Azerbaijan
-
 Bahamas
-
 Bahrain
-
 Bangladesh
-
 Belarus
-
 Belgium
-
 Bolivia
-
 Botswana
-
 Brazil
-
 Brunei
-
 Bulgaria
-
 Cambodia
-
 Cameroon
-
 Canada
-
 Chile
Chile
-
 China
China
-
 Colombia
-
 Congo
Congo
-
 Costa Rica
-
 Cote d'Ivoire
-
 Croatia
-
 Cuba
Cuba
-
 Cyprus
-
 Czechia
-
 DR Congo
-
 Denmark
-
 Dominican Republic
-
 Ecuador
-
 Egypt
Egypt
-
 El Salvador
-
 Estonia
-
 Eswatini
-
 Ethiopia
-
 Finland
-
 France
-
 Georgia
-
 Germany
-
 Ghana
Ghana
-
 Greece
-
 Haiti
Haiti
-
 Hong Kong
-
 Hungary
-
 India
India
-
 Indonesia
-
 Iran, Islamic republic
-
 Iraq
Iraq
-
 Ireland
-
 Israel
-
 Italy
Italy
-
 Jamaica
-
 Japan
Japan
-
 Jordan
-
 Kazakhstan
-
 Kenya
Kenya
-
 Korea
Korea
-
 Kuwait
-
 Kyrgyzstan
-
 Laos
Laos
-
 Latvia
-
 Lebanon
-
 Lesotho
-
 Libya
Libya
-
 Lithuania
-
 Luxembourg
-
 Madagascar
-
 Malaysia
-
 Malta
Malta
-
 Mauritius
-
 Mexico
-
 Moldova
-
 Mongolia
-
 Montenegro
-
 Morocco
-
 Mozambique
-
 Myanmar
-
 Namibia
-
 Nepal
Nepal
-
 Netherlands
-
 New Zealand
-
 Nigeria
-
 North Macedonia
-
 Norway
-
 Oman
Oman
-
 Pakistan
-
 Palestine
-
 Panama
-
 Papua New Guinea
-
 Paraguay
-
 Peru
Peru
-
 Philippines
-
 Poland
-
 Portugal
-
 Puerto Rico
-
 Qatar
Qatar
-
 Reunion
-
 Romania
-
 Rwanda
-
 Saudi Arabia
-
 Serbia
-
 Singapore
-
 Slovakia
-
 Slovenia
-
 Somalia
-
 South Africa
-
 Spain
Spain
-
 Sri Lanka
-
 Sweden
-
 Switzerland
-
 Syria
Syria
-
 Taiwan
-
 Tajikistan
-
 Tanzania
-
 Thailand
-
 Trinidad and Tobago
-
 Tunisia
-
 Turkey
-
 UAE
UAE
-
 Uganda
-
 Ukraine
-
 United Kingdom
-
United States
-
 Uruguay
-
 Uzbekistan
-
 Venezuela
-
 Vietnam
-
 Yemen
Yemen
-
 Zambia
-
 Zimbabwe
- Forex
- Crypto












