

Pendle technical analysis: Downward price move with oversold signals and $1.791 support in focus

Pendle (PENDLE) is trading at $1.947, marking a daily decrease of 10.61%. The price is currently positioned below its key moving averages on short- and medium-term timeframes, while holding above long-term averages amid elevated volatility.
 2.087
2.2400
2.087
2.2400
Highlights
- Pendle Finance offers a 153% APY on its TradFi ETF to attract traditional finance investors with highly competitive yields.
- Pendle manages about $1.3 billion in total value locked and allocates 80% of protocol fees to buybacks, supporting ongoing liquidity management.
- PENDLE/USD trades below key moving averages with strong bearish momentum, expected to remain in the $1.791 to $2.007 range through the next 2 to 3 days.
Inflow incentives and buyback strategy as Pendle targets new investors
Pendle Finance has introduced a 153% APY for its TradFi ETF, aiming to attract traditional finance investors through highly competitive yields, according to Coinfomania. This direct incentive is positioned to stimulate new demand inflows, though its sustainability may raise questions as the market responds to the announcement. In addition, Cryptonews reported Pendle's significant presence in the real-world asset sector, highlighted by approximately $1.3 billion in total value locked and a buyback strategy channeling 80% of protocol fees, underscoring the protocol's continued liquidity management efforts.
Bearish signals strengthen as selling pressure breaches key averages
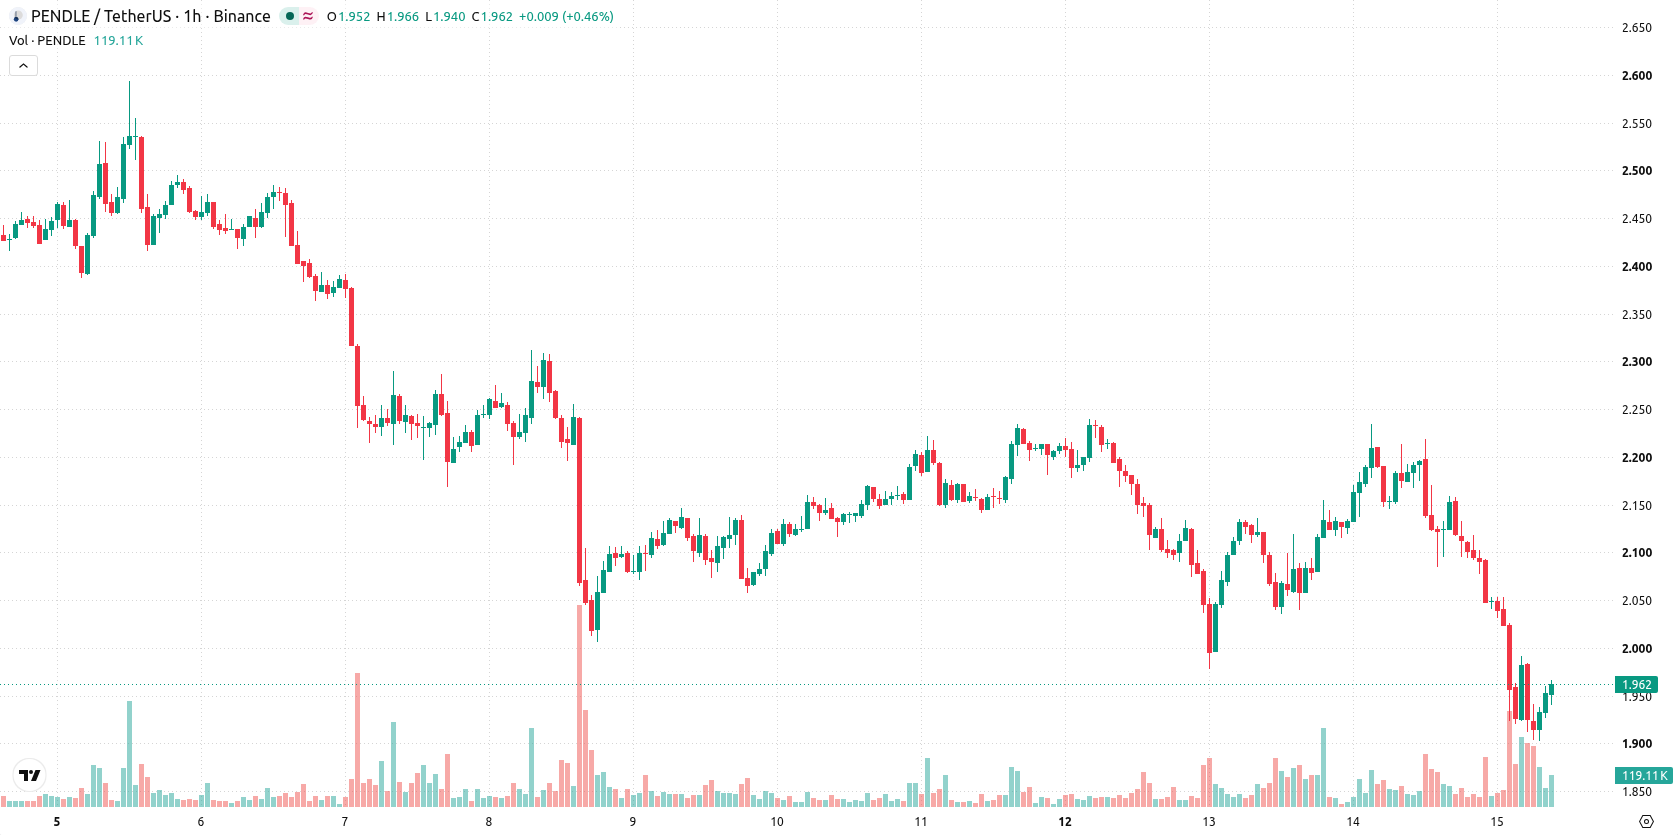
On the technical front, PENDLE/USD is trading below both the MA-20 and MA-50 on the H1 chart, with price action still above the MA-200. The Ichimoku Kijun level at $2.0605 represents immediate resistance. Momentum indicators confirm selling pressure: MACD and ADX are on "Sell" signals, while RSI stands at 31, with CCI also indicating oversold levels and Stoch RSI reading as neutral. Bull/Bear Power points to intraday seller control, and the asset's sharp intraday drop aligns with this strong downside momentum.
Downside risk persists as price constrained below resistance
Over the next 2–3 trading days, PENDLE/USD is likely to range between $1.791 and $2.007, within a typical volatility band for the present market context. There is a high probability of further downward movement, with only minimal likelihood of a sustained recovery unless price can decisively clear the $2.0605 resistance. If price consolidates, it should remain capped within this range, while a close below $1.791 would suggest the risk of further declines.
Earlier, analysts noted that Pendle was experiencing persistent downside momentum despite ongoing protocol developments and long-term structural strength. The latest trading action reinforces those concerns, with intensified selling pressure and a key technical level at $2.0605 now serving as a critical threshold for any potential reversal or further decline.




Latest Pendle News





-
 Afghanistan
-
 Albania
-
 Algeria
-
 Angola
-
 Argentina
-
 Armenia
-
 Australia
-
 Austria
-
 Azerbaijan
-
 Bahamas
-
 Bahrain
-
 Bangladesh
-
 Belarus
-
 Belgium
-
 Bolivia
-
 Botswana
-
 Brazil
-
 Brunei
-
 Bulgaria
-
 Cambodia
-
 Cameroon
-
 Canada
-
 Chile
Chile
-
 China
China
-
 Colombia
-
 Congo
Congo
-
 Costa Rica
-
 Cote d'Ivoire
-
 Croatia
-
 Cuba
Cuba
-
 Cyprus
-
 Czechia
-
 DR Congo
-
 Denmark
-
 Dominican Republic
-
 Ecuador
-
 Egypt
Egypt
-
 El Salvador
-
 Estonia
-
 Eswatini
-
 Ethiopia
-
 Finland
-
 France
-
 Georgia
-
 Germany
-
 Ghana
Ghana
-
 Greece
-
 Haiti
Haiti
-
 Hong Kong
-
 Hungary
-
 India
India
-
 Indonesia
-
 Iran, Islamic republic
-
 Iraq
Iraq
-
 Ireland
-
 Israel
-
 Italy
Italy
-
 Jamaica
-
 Japan
Japan
-
 Jordan
-
 Kazakhstan
-
 Kenya
Kenya
-
 Korea
Korea
-
 Kuwait
-
 Kyrgyzstan
-
 Laos
Laos
-
 Latvia
-
 Lebanon
-
 Lesotho
-
 Libya
Libya
-
 Lithuania
-
 Luxembourg
-
 Madagascar
-
 Malaysia
-
 Malta
Malta
-
 Mauritius
-
 Mexico
-
 Moldova
-
 Mongolia
-
 Montenegro
-
 Morocco
-
 Mozambique
-
 Myanmar
-
 Namibia
-
 Nepal
Nepal
-
 Netherlands
-
 New Zealand
-
 Nigeria
-
 North Macedonia
-
 Norway
-
 Oman
Oman
-
 Pakistan
-
 Palestine
-
 Panama
-
 Papua New Guinea
-
 Paraguay
-
 Peru
Peru
-
 Philippines
-
 Poland
-
 Portugal
-
 Puerto Rico
-
 Qatar
Qatar
-
 Reunion
-
 Romania
-
 Rwanda
-
 Saudi Arabia
-
 Serbia
-
 Singapore
-
 Slovakia
-
 Slovenia
-
 Somalia
-
 South Africa
-
 Spain
Spain
-
 Sri Lanka
-
 Sweden
-
 Switzerland
-
 Syria
Syria
-
 Taiwan
-
 Tajikistan
-
 Tanzania
-
 Thailand
-
 Trinidad and Tobago
-
 Tunisia
-
 Turkey
-
 UAE
UAE
-
 Uganda
-
 Ukraine
-
 United Kingdom
-
United States
-
 Uruguay
-
 Uzbekistan
-
 Venezuela
-
 Vietnam
-
 Yemen
Yemen
-
 Zambia
-
 Zimbabwe
- Forex
- Crypto












