

What's behind Jito's latest 12.3% price pullback?

Jito (JTO) fell 12.25% today as heavy selling pressure and dominant oversold signals drove the price downward. The move is supported by a prevailing bearish technical structure, with JTO trading below all key moving averages and immediate support levels close by.
 0.2671
0.3408
Highlights
- JTO/USD trades below all key moving averages, indicating a persistent bearish structure across short-, medium-, and long-term timeframes.
- JTO/USD fell 12.25% to $0.4586 today, following a significant downside gap and sustained seller activity with volatility at 10.78%.
- The expected five-day range is $0.4042 to $0.51, with a 68% probability of moving lower and multiple signals showing oversold conditions but weak trend strength.
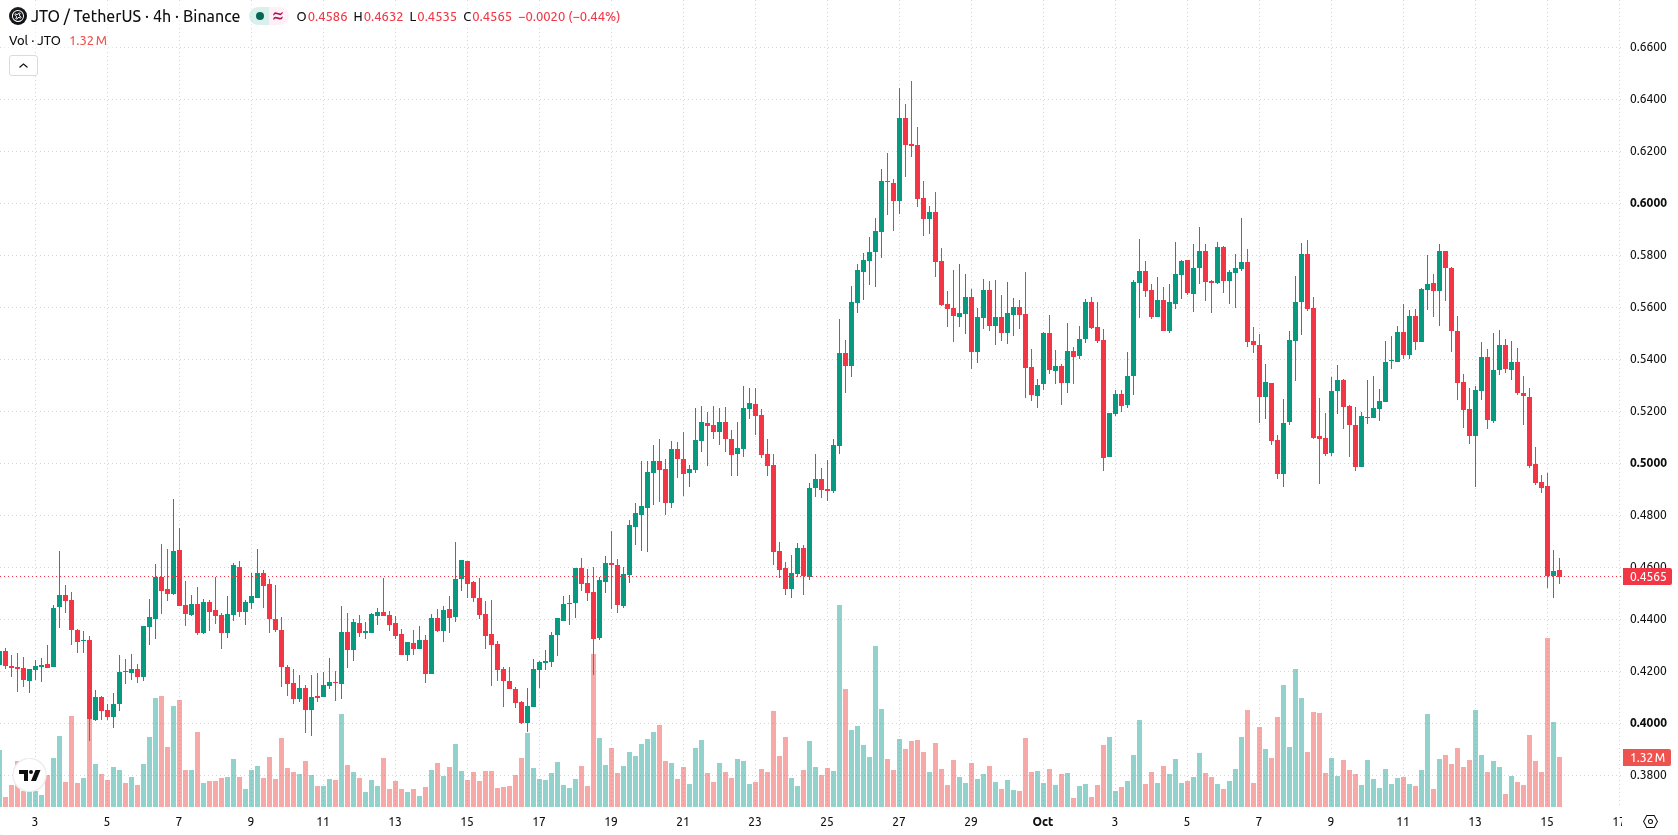
Mixed momentum as support approaches amid persistent downside signals
JTO/USD is trading below its 20-day ($0.5488), 50-day ($0.4936), and 200-day ($0.5125) moving averages, confirming a bearish outlook across all major timeframes. Resistance is seen at $0.4884 and immediate support at $0.4479, with the Ichimoku Kijun at $0.5447 further reinforcing the trend bias to the downside. Momentum indicators remain mixed: the MACD shows strong buy momentum, but the ADX at 12.5105 is neutral, suggesting weak trend strength. The RSI at 45.495 points to a sell signal near neutral, and both the Stochastic RSI and CCI are deeply oversold (Stochastic RSI: 0, CCI: -123.6167), reflecting increased seller activity. Bull/Bear Power at 0.0153 identifies buyers as slightly dominant in intraday action, and the Awesome Oscillator remains neutral, not currently supporting either side.
Earlier, analysts noted that Jito was under sustained bearish momentum, dominated by persistent selling pressure and a lack of bullish catalysts. The current technical environment reinforces this view, with traders advised to closely monitor the $0.4479 level as a potential trigger for further downside if breached.










-
 Afghanistan
-
 Albania
-
 Algeria
-
 Angola
-
 Argentina
-
 Armenia
-
 Australia
-
 Austria
-
 Azerbaijan
-
 Bahamas
-
 Bahrain
-
 Bangladesh
-
 Belarus
-
 Belgium
-
 Bolivia
-
 Botswana
-
 Brazil
-
 Brunei
-
 Bulgaria
-
 Cambodia
-
 Cameroon
-
 Canada
-
 Chile
-
 China
-
 Colombia
-
 Congo
-
 Costa Rica
-
 Cote d'Ivoire
-
 Croatia
-
 Cuba
-
 Cyprus
-
 Czechia
-
 DR Congo
-
 Denmark
-
 Dominican Republic
-
 Ecuador
-
 Egypt
-
 El Salvador
-
 Estonia
-
 Eswatini
-
 Ethiopia
-
 Finland
-
 France
-
 Georgia
-
 Germany
-
 Ghana
-
 Greece
-
 Haiti
-
 Hong Kong
-
 Hungary
-
 India
-
 Indonesia
-
 Iran, Islamic republic
-
 Iraq
-
 Ireland
-
 Israel
-
 Italy
-
 Jamaica
-
 Japan
-
 Jordan
-
 Kazakhstan
-
 Kenya
-
 Korea
-
 Kuwait
-
 Kyrgyzstan
-
 Laos
-
 Latvia
-
 Lebanon
-
 Lesotho
-
 Libya
-
 Lithuania
-
 Luxembourg
-
 Madagascar
-
 Malaysia
-
 Malta
-
 Mauritius
-
 Mexico
-
 Moldova
-
 Mongolia
-
 Montenegro
-
 Morocco
-
 Mozambique
-
 Myanmar
-
 Namibia
-
 Nepal
-
 Netherlands
-
 New Zealand
-
 Nigeria
-
 North Macedonia
-
 Norway
-
 Oman
-
 Pakistan
-
 Palestine
-
 Panama
-
 Papua New Guinea
-
 Paraguay
-
 Peru
-
 Philippines
-
 Poland
-
 Portugal
-
 Puerto Rico
-
 Qatar
-
 Reunion
-
 Romania
-
 Rwanda
-
 Saudi Arabia
-
 Serbia
-
 Singapore
-
 Slovakia
-
 Slovenia
-
 Somalia
-
 South Africa
-
 Spain
-
 Sri Lanka
-
 Sweden
-
 Switzerland
-
 Syria
-
 Taiwan
-
 Tajikistan
-
 Tanzania
-
 Thailand
-
 Trinidad and Tobago
-
 Tunisia
-
 Turkey
-
 UAE
-
 Uganda
-
 Ukraine
-
 United Kingdom
-
United States
-
 Uruguay
-
 Uzbekistan
-
 Venezuela
-
 Vietnam
-
 Yemen
-
 Zambia
-
 Zimbabwe
- Forex
- Crypto












