

Uniswap falls amid long liquidations and strong seller pressure

Uniswap (UNI) is trading at $6.86 after falling 7.21% from the prior session. The token sits below its short- and medium-term moving averages but remains well above long-term trend measures, indicating high volatility with a clear downside bias for today's price action.
 7.36
7.9010
7.36
7.9010
Highlights
- Uniswap v4 recorded $44 billion in trading volume over 30 days, accounting for nearly half of all protocol activity and indicating strong engagement.
- Recent market action featured $1.45 million in long liquidations and $10,000 in short liquidations on major exchanges, alongside pronounced selling pressure.
- UNI/USD trades sharply lower near $6.863 with most technical indicators signaling continued downside and an expected 2 to 3 day range of $6.349 to $7.1222.
Selling pressure intensifies despite surging Uniswap trading activity
Uniswap v4 recorded more than $44 billion in trading volume over the last 30 days, accounting for nearly half of all protocol activity and signaling robust user engagement, according to Tronweekly. This period also saw $1.45 million in long liquidations and $10,000 in short liquidations across Binance, Bybit, and OKX, as reported by Tokenpost, leading to abrupt forced selling that intensified market volatility. Additionally, Uniswap was listed as the 27th-ranked crypto asset with a market capitalization of approximately $4.46 billion, according to Tokenpost. Despite substantial turnover and platform activity, these factors have coincided with pronounced selling pressure in the current session.
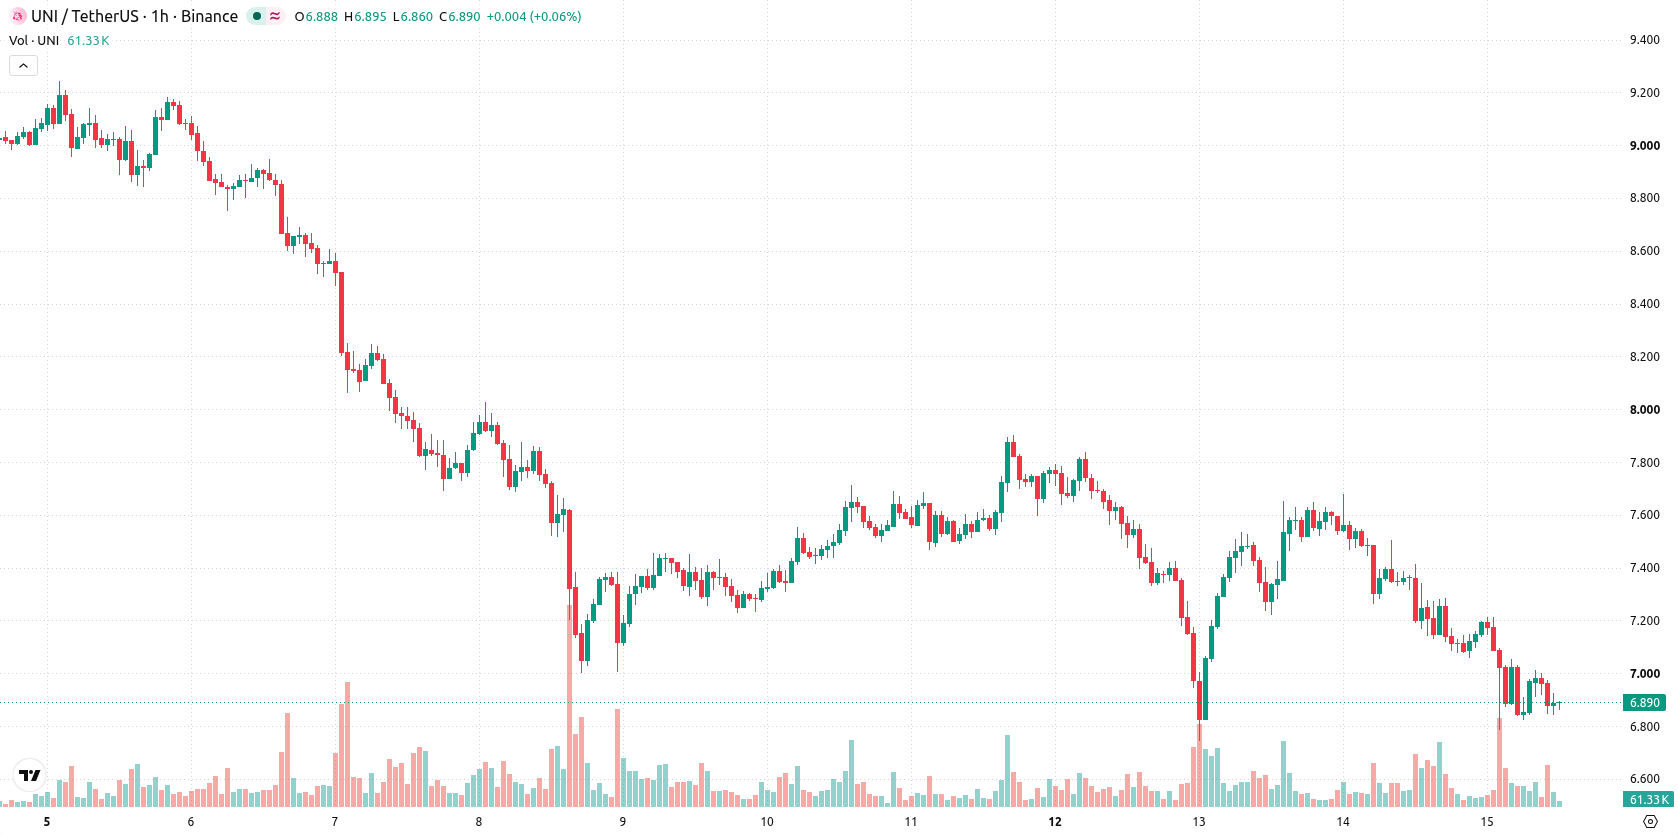
Bearish momentum confirmed as UNI struggles below key moving averages
On the technical front, UNI/USD is trading below the MA-20 and MA-50 on the hourly chart, indicating ongoing short- and medium-term downside pressure. The price holds above the MA-200, which provides a measure of long-term support, while the Ichimoku Kijun level at $7.0985 acts as the nearest resistance. Among indicators, MACD and ADX show 'Sell' signals, with RSI reading 36.86 and CCI in an oversold condition. Stoch RSI is neutral, suggesting potential exhaustion, while Bull/Bear Power confirms seller dominance and the Awesome Oscillator sits in a neutral state, not confirming the prevailing trend. Overall, intraday momentum aligns with a majority of bearish signals, though some oscillators are mixed.
Downward risk elevated as sideways range defines near-term outlook
For the next two to three trading days, UNI is expected to range between $6.349 and $7.1222, reflecting its current high volatility. The probability of an upward move remains very low, with further downside being significantly more likely in the short term. A sideways corridor between support and resistance is the baseline scenario. A bullish shift would require a decisive move above the $7.0985 resistance, while further losses could develop if UNI drops below the bottom of the projected range.
Earlier, analysts noted that Uniswap was positioned above key trend lines and exhibiting signs of bullish consolidation. The latest price action marks a clear shift to downside volatility, with traders advised to monitor the $7.0985 resistance as a potential pivot for reversing current short-term weakness.




Latest Uniswap (UNI) News





-
 Afghanistan
-
 Albania
-
 Algeria
-
 Angola
-
 Argentina
-
 Armenia
-
 Australia
-
 Austria
-
 Azerbaijan
-
 Bahamas
-
 Bahrain
-
 Bangladesh
-
 Belarus
-
 Belgium
-
 Bolivia
-
 Botswana
-
 Brazil
-
 Brunei
-
 Bulgaria
-
 Cambodia
-
 Cameroon
-
 Canada
-
 Chile
Chile
-
 China
China
-
 Colombia
-
 Congo
Congo
-
 Costa Rica
-
 Cote d'Ivoire
-
 Croatia
-
 Cuba
Cuba
-
 Cyprus
-
 Czechia
-
 DR Congo
-
 Denmark
-
 Dominican Republic
-
 Ecuador
-
 Egypt
Egypt
-
 El Salvador
-
 Estonia
-
 Eswatini
-
 Ethiopia
-
 Finland
-
 France
-
 Georgia
-
 Germany
-
 Ghana
Ghana
-
 Greece
-
 Haiti
Haiti
-
 Hong Kong
-
 Hungary
-
 India
India
-
 Indonesia
-
 Iran, Islamic republic
-
 Iraq
Iraq
-
 Ireland
-
 Israel
-
 Italy
Italy
-
 Jamaica
-
 Japan
Japan
-
 Jordan
-
 Kazakhstan
-
 Kenya
Kenya
-
 Korea
Korea
-
 Kuwait
-
 Kyrgyzstan
-
 Laos
Laos
-
 Latvia
-
 Lebanon
-
 Lesotho
-
 Libya
Libya
-
 Lithuania
-
 Luxembourg
-
 Madagascar
-
 Malaysia
-
 Malta
Malta
-
 Mauritius
-
 Mexico
-
 Moldova
-
 Mongolia
-
 Montenegro
-
 Morocco
-
 Mozambique
-
 Myanmar
-
 Namibia
-
 Nepal
Nepal
-
 Netherlands
-
 New Zealand
-
 Nigeria
-
 North Macedonia
-
 Norway
-
 Oman
Oman
-
 Pakistan
-
 Palestine
-
 Panama
-
 Papua New Guinea
-
 Paraguay
-
 Peru
Peru
-
 Philippines
-
 Poland
-
 Portugal
-
 Puerto Rico
-
 Qatar
Qatar
-
 Reunion
-
 Romania
-
 Rwanda
-
 Saudi Arabia
-
 Serbia
-
 Singapore
-
 Slovakia
-
 Slovenia
-
 Somalia
-
 South Africa
-
 Spain
Spain
-
 Sri Lanka
-
 Sweden
-
 Switzerland
-
 Syria
Syria
-
 Taiwan
-
 Tajikistan
-
 Tanzania
-
 Thailand
-
 Trinidad and Tobago
-
 Tunisia
-
 Turkey
-
 UAE
UAE
-
 Uganda
-
 Ukraine
-
 United Kingdom
-
United States
-
 Uruguay
-
 Uzbekistan
-
 Venezuela
-
 Vietnam
-
 Yemen
Yemen
-
 Zambia
-
 Zimbabwe
- Forex
- Crypto












