

Will FLOW break $0.0342 resistance amid continued bullish pressure?

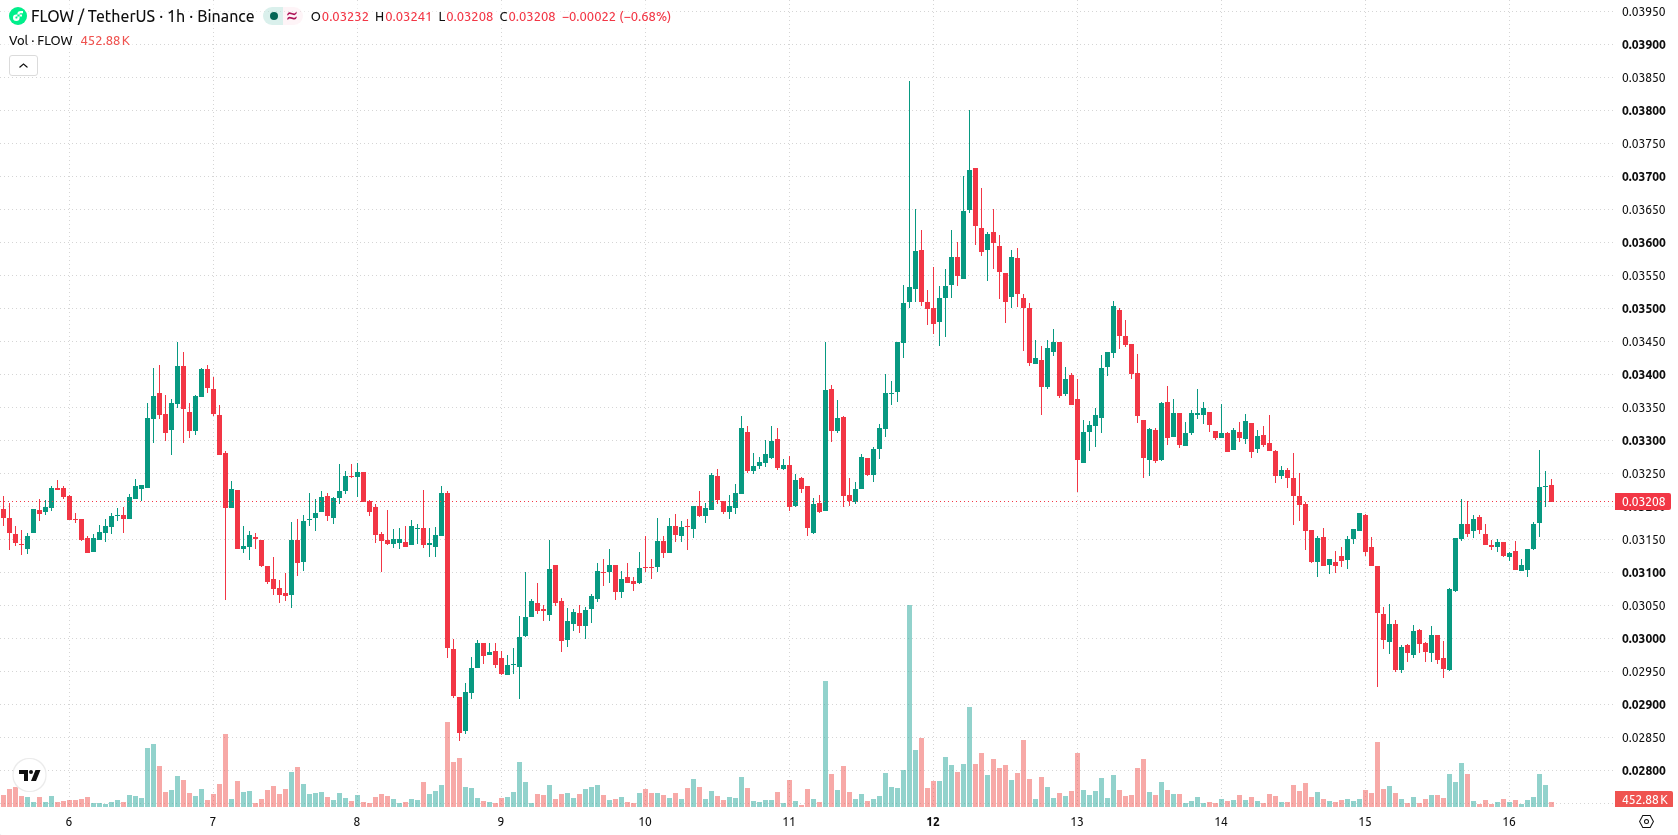
Flow (FLOW) is trading at $0.0321, up 8.25% on the day. The asset is positioned above its key moving averages, reflecting strong upward momentum amid high intraday volatility.
 0.0325
0.0385
0.0325
0.0385
Highlights
- FLOW/USD trades above key moving averages, confirming a bullish short- and medium-term structure with intact long-term support.
- Momentum indicators such as MACD and ADX confirm strong upward movement, but overbought readings suggest room for a pullback or slower gains.
- Expected trading range for the next 2 to 3 days is $0.03 to $0.0342, with high volatility and a greater probability of an upside move.
Technical momentum accelerates as indicators signal overbought risk
On the hourly chart, FLOW trades above the MA-20 ($0.0312) and MA-50 ($0.0313) levels, and also remains above the MA-200 ($0.0311) on the daily timeframe. The Ichimoku Kijun at $0.0311 serves as immediate support. Bullish momentum is observed, with both MACD and ADX indicating upward pressure. RSI stands at 63.12, while Stoch RSI and CCI remain in overbought territory, hinting at the likelihood of a near-term pullback or a moderation in upside pace. Intraday, Bull/Bear Power is firmly in favor of buyers and the Awesome Oscillator confirms this momentum, reflecting strong buyer dominance.
Range-bound outlook as volatility defines breakout scenarios
Over the next 2–3 trading days, the expected price range is $0.03 to $0.0342, reflecting the prevailing volatility band relative to current levels. The baseline scenario envisions consolidation within this interval. A bullish move could see a breakout above resistance toward the upper band near $0.0342, while a dip below the $0.0311 support would signal a shift toward lower price targets.
Earlier, analysts noted that Flow was experiencing sustained technical weakness with continued downside momentum. The current upward move represents a decisive shift, highlighting $0.0311 as a key support level—any sustained move below this threshold could reintroduce downside risks in the near term.









-
 Afghanistan
-
 Albania
-
 Algeria
-
 Angola
-
 Argentina
-
 Armenia
-
 Australia
-
 Austria
-
 Azerbaijan
-
 Bahamas
-
 Bahrain
-
 Bangladesh
-
 Belarus
-
 Belgium
-
 Bolivia
-
 Botswana
-
 Brazil
-
 Brunei
-
 Bulgaria
-
 Cambodia
-
 Cameroon
-
 Canada
-
 Chile
Chile
-
 China
China
-
 Colombia
-
 Congo
Congo
-
 Costa Rica
-
 Cote d'Ivoire
-
 Croatia
-
 Cuba
Cuba
-
 Cyprus
-
 Czechia
-
 DR Congo
-
 Denmark
-
 Dominican Republic
-
 Ecuador
-
 Egypt
Egypt
-
 El Salvador
-
 Estonia
-
 Eswatini
-
 Ethiopia
-
 Finland
-
 France
-
 Georgia
-
 Germany
-
 Ghana
Ghana
-
 Greece
-
 Haiti
Haiti
-
 Hong Kong
-
 Hungary
-
 India
India
-
 Indonesia
-
 Iran, Islamic republic
-
 Iraq
Iraq
-
 Ireland
-
 Israel
-
 Italy
Italy
-
 Jamaica
-
 Japan
Japan
-
 Jordan
-
 Kazakhstan
-
 Kenya
Kenya
-
 Korea
Korea
-
 Kuwait
-
 Kyrgyzstan
-
 Laos
Laos
-
 Latvia
-
 Lebanon
-
 Lesotho
-
 Libya
Libya
-
 Lithuania
-
 Luxembourg
-
 Madagascar
-
 Malaysia
-
 Malta
Malta
-
 Mauritius
-
 Mexico
-
 Moldova
-
 Mongolia
-
 Montenegro
-
 Morocco
-
 Mozambique
-
 Myanmar
-
 Namibia
-
 Nepal
Nepal
-
 Netherlands
-
 New Zealand
-
 Nigeria
-
 North Macedonia
-
 Norway
-
 Oman
Oman
-
 Pakistan
-
 Palestine
-
 Panama
-
 Papua New Guinea
-
 Paraguay
-
 Peru
Peru
-
 Philippines
-
 Poland
-
 Portugal
-
 Puerto Rico
-
 Qatar
Qatar
-
 Reunion
-
 Romania
-
 Rwanda
-
 Saudi Arabia
-
 Serbia
-
 Singapore
-
 Slovakia
-
 Slovenia
-
 Somalia
-
 South Africa
-
 Spain
Spain
-
 Sri Lanka
-
 Sweden
-
 Switzerland
-
 Syria
Syria
-
 Taiwan
-
 Tajikistan
-
 Tanzania
-
 Thailand
-
 Trinidad and Tobago
-
 Tunisia
-
 Turkey
-
 UAE
UAE
-
 Uganda
-
 Ukraine
-
 United Kingdom
-
United States
-
 Uruguay
-
 Uzbekistan
-
 Venezuela
-
 Vietnam
-
 Yemen
Yemen
-
 Zambia
-
 Zimbabwe
- Forex
- Crypto












