

Chainlink trading stays rangebound amid institutional ETF inflows but falling asset values: weekly analysis

Chainlink (LINK) is now trading near $12.70, having declined around 1% over the past week as sellers drove the setup deep into oversold territory. Despite bearish momentum on the chart, technical readings signal conflicting conditions, keeping the outlook finely balanced heading into the new week.
 12.08
13.19
Highlights
- Chainlink is trading at $12.72, down 1.36% over the past seven days with near-term momentum weakening.
- The price remains above the 200-day average, indicating a bullish long-term structure despite current selling pressure.
- Immediate support is at $12.63 and resistance at $13.51, with next week’s expected range between $11.82 and $13.63.
ETF inflows and sector leadership offset LINK value drop over the week
Chainlink saw renewed institutional focus this week, as LINK-focused ETFs such as the Bitwise Chainlink ETF attracted about $10 million in inflows, according to TokenPost. However, net assets dropped due to a decline in LINK's market value. The asset continued to dominate the decentralized oracle sector and rolled out new data infrastructure on the Stellar blockchain to help drive decentralized finance applications, as reported by Bitcoin.com and The Cryptonomist.
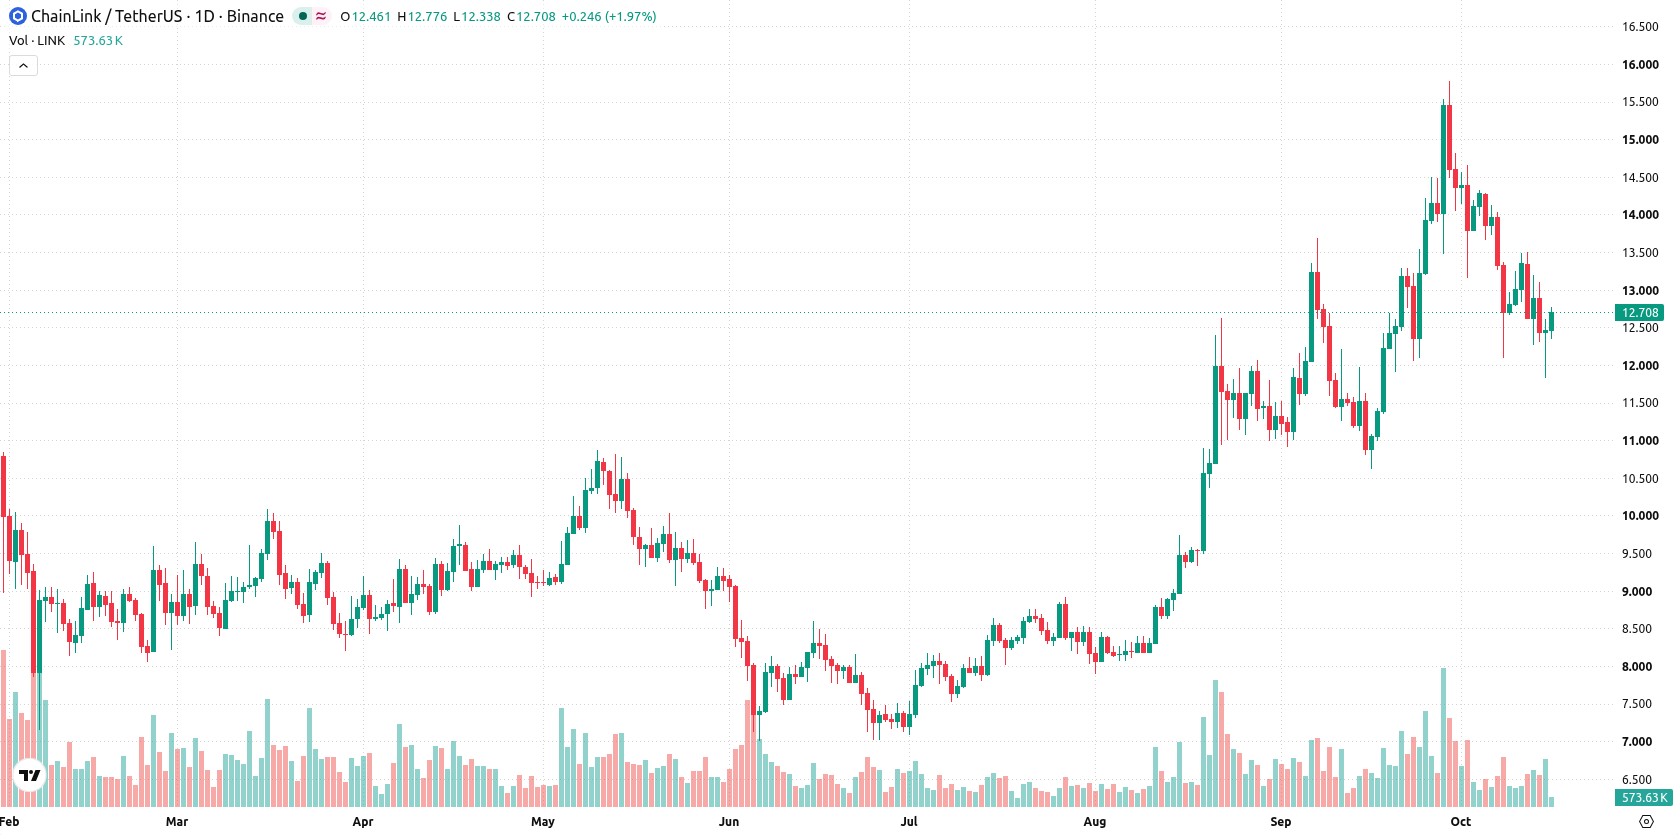
Oversold conditions persist as trend weakens and key support stabilizes
On the daily chart, Chainlink has entered a sustained move lower with a firm trend as indicated by a 14.3% volatility and price slipping below the MA-20. Momentum indicators diverge: CCI stands at -128.66 and Stochastic RSI at 8.64, both in oversold territory, while RSI remains neutral at 45.36. Immediate support is found at $12.63 and resistance sits at $13.51, with the Ichimoku Kijun at $13.8 acting as an additional resistance level. This setup suggests sellers are currently dominant, but oversold signals may limit immediate downside.
Breakout risk rises as next week’s range narrows around support levels
Next week, the expected range is $11.82 to $13.63, with a 48% probability of an increase and a 52% probability of a decrease. The base case is continued trading between $12.63 support and $13.51 resistance. A bullish break above $13.51 could see momentum build toward $13.63. If price slips below $12.63, the risk increases for a test of the $11.82 low.
Earlier, analysts noted that Chainlink had entered a period of heightened volatility with a prevailing downside risk and persistent technical resistance. The current analysis builds on this by highlighting conflicting momentum signals and renewed institutional flows, making it important for traders to monitor the $12.63 support and $13.51 resistance as potential inflection points in the coming sessions.





Latest Chainlink News





-
 Afghanistan
-
 Albania
-
 Algeria
-
 Angola
-
 Argentina
-
 Armenia
-
 Australia
-
 Austria
-
 Azerbaijan
-
 Bahamas
-
 Bahrain
-
 Bangladesh
-
 Belarus
-
 Belgium
-
 Bolivia
-
 Botswana
-
 Brazil
-
 Brunei
-
 Bulgaria
-
 Cambodia
-
 Cameroon
-
 Canada
-
 Chile
-
 China
-
 Colombia
-
 Congo
-
 Costa Rica
-
 Cote d'Ivoire
-
 Croatia
-
 Cuba
-
 Cyprus
-
 Czechia
-
 DR Congo
-
 Denmark
-
 Dominican Republic
-
 Ecuador
-
 Egypt
-
 El Salvador
-
 Estonia
-
 Eswatini
-
 Ethiopia
-
 Finland
-
 France
-
 Georgia
-
 Germany
-
 Ghana
-
 Greece
-
 Haiti
-
 Hong Kong
-
 Hungary
-
 India
-
 Indonesia
-
 Iran, Islamic republic
-
 Iraq
-
 Ireland
-
 Israel
-
 Italy
-
 Jamaica
-
 Japan
-
 Jordan
-
 Kazakhstan
-
 Kenya
-
 Korea
-
 Kuwait
-
 Kyrgyzstan
-
 Laos
-
 Latvia
-
 Lebanon
-
 Lesotho
-
 Libya
-
 Lithuania
-
 Luxembourg
-
 Madagascar
-
 Malaysia
-
 Malta
-
 Mauritius
-
 Mexico
-
 Moldova
-
 Mongolia
-
 Montenegro
-
 Morocco
-
 Mozambique
-
 Myanmar
-
 Namibia
-
 Nepal
-
 Netherlands
-
 New Zealand
-
 Nigeria
-
 North Macedonia
-
 Norway
-
 Oman
-
 Pakistan
-
 Palestine
-
 Panama
-
 Papua New Guinea
-
 Paraguay
-
 Peru
-
 Philippines
-
 Poland
-
 Portugal
-
 Puerto Rico
-
 Qatar
-
 Reunion
-
 Romania
-
 Rwanda
-
 Saudi Arabia
-
 Serbia
-
 Singapore
-
 Slovakia
-
 Slovenia
-
 Somalia
-
 South Africa
-
 Spain
-
 Sri Lanka
-
 Sweden
-
 Switzerland
-
 Syria
-
 Taiwan
-
 Tajikistan
-
 Tanzania
-
 Thailand
-
 Trinidad and Tobago
-
 Tunisia
-
 Turkey
-
 UAE
-
 Uganda
-
 Ukraine
-
 United Kingdom
-
United States
-
 Uruguay
-
 Uzbekistan
-
 Venezuela
-
 Vietnam
-
 Yemen
-
 Zambia
-
 Zimbabwe
- Forex
- Crypto












