

Stellar faces resistance from technical signals as MACD and Bull/Bear Power point to further weakness: weekly analysis

Stellar (XLM) has drifted near $0.18 after falling by around 5% over the past week, as oversold daily momentum clashes with a lack of sustained support. Technical signals show pronounced weakness, so traders will watch closely for signs of stabilization or a further breakdown over the coming week.
 0.1721
0.1752
Highlights
- Stellar trades at $0.1842 after dropping 5.29% over the past week, breaking below short-term moving averages.
- Momentum indicators indicate a bearish tilt as MACD and Bull/Bear Power both flash sell, with Stoch RSI in oversold territory.
- Stellar is projected to fluctuate between $0.1683 and $0.2045 this week, with resistance at $0.1961 and a 77% probability of further declines.
Institutional interest grows as token demand remains subdued for XLM
Chainlink's data infrastructure, including Data Feeds and Data Streams, launched on the Stellar blockchain in mid-October, expanding the platform's potential for decentralized finance applications, according to CryptoBriefing. However, several news sources pointed out that while tokenized assets on the network have risen to around $3.5 billion and institutional adoption efforts continue, most new capital is directed toward the underlying securities rather than boosting demand for XLM. Network activity and transaction fees hit notable lows even as usage spiked, reflecting limited direct benefit for the token.
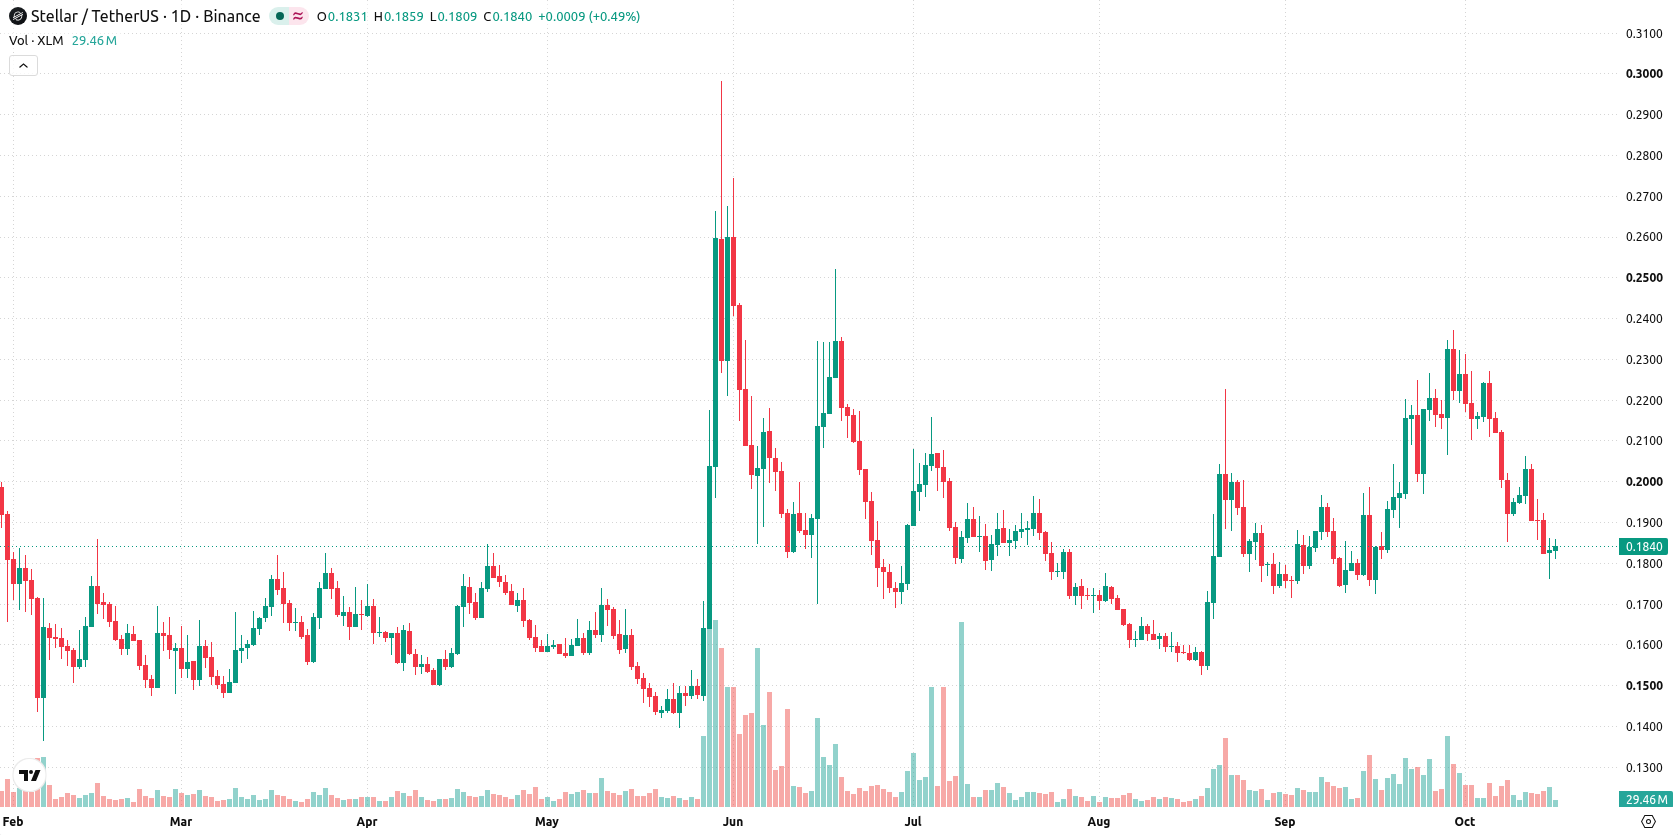
Momentum divergence deepens as daily indicators and support levels come into play
On the daily chart, the structure shows weakness following a sharp move lower without a sustained trend, as highlighted by volatile price action at 17.04%. MACD and Bull/Bear Power both signal sell, while the Stoch RSI reading of 9.6057 is firmly in oversold territory, creating a notable divergence between momentum and trend signals. Immediate support lies at the MA-200 at $0.1823, with resistance at the MA-50 at $0.1961 and further pushback at the Ichimoku Kijun level of $0.2066.
Downside bias prevails as choppy range trading anticipated next week
Over the coming week, Stellar is expected to trade between $0.1683 and $0.2045. There is a 23% probability of an increase and a 77% probability of a decrease. The base case points to continued choppy action inside the defined range, with any push above $0.1961 opening the door for a test of $0.2045. If price falls below the $0.1823 support, downside momentum could extend toward the $0.1683 area.
Earlier, analysts noted that despite increased regulatory clarity and institutional activity, Stellar remained under downside pressure amid persistent bearish momentum. The current analysis strengthens this view with fresh signals of technical weakness and declining network activity, suggesting further downside risk if price slips below the $0.1823 support level.











-
 Afghanistan
-
 Albania
-
 Algeria
-
 Angola
-
 Argentina
-
 Armenia
-
 Australia
-
 Austria
-
 Azerbaijan
-
 Bahamas
-
 Bahrain
-
 Bangladesh
-
 Belarus
-
 Belgium
-
 Bolivia
-
 Botswana
-
 Brazil
-
 Brunei
-
 Bulgaria
-
 Cambodia
-
 Cameroon
-
 Canada
-
 Chile
-
 China
-
 Colombia
-
 Congo
-
 Costa Rica
-
 Cote d'Ivoire
-
 Croatia
-
 Cuba
-
 Cyprus
-
 Czechia
-
 DR Congo
-
 Denmark
-
 Dominican Republic
-
 Ecuador
-
 Egypt
-
 El Salvador
-
 Estonia
-
 Eswatini
-
 Ethiopia
-
 Finland
-
 France
-
 Georgia
-
 Germany
-
 Ghana
-
 Greece
-
 Haiti
-
 Hong Kong
-
 Hungary
-
 India
-
 Indonesia
-
 Iran, Islamic republic
-
 Iraq
-
 Ireland
-
 Israel
-
 Italy
-
 Jamaica
-
 Japan
-
 Jordan
-
 Kazakhstan
-
 Kenya
-
 Korea
-
 Kuwait
-
 Kyrgyzstan
-
 Laos
-
 Latvia
-
 Lebanon
-
 Lesotho
-
 Libya
-
 Lithuania
-
 Luxembourg
-
 Madagascar
-
 Malaysia
-
 Malta
-
 Mauritius
-
 Mexico
-
 Moldova
-
 Mongolia
-
 Montenegro
-
 Morocco
-
 Mozambique
-
 Myanmar
-
 Namibia
-
 Nepal
-
 Netherlands
-
 New Zealand
-
 Nigeria
-
 North Macedonia
-
 Norway
-
 Oman
-
 Pakistan
-
 Palestine
-
 Panama
-
 Papua New Guinea
-
 Paraguay
-
 Peru
-
 Philippines
-
 Poland
-
 Portugal
-
 Puerto Rico
-
 Qatar
-
 Reunion
-
 Romania
-
 Rwanda
-
 Saudi Arabia
-
 Serbia
-
 Singapore
-
 Slovakia
-
 Slovenia
-
 Somalia
-
 South Africa
-
 Spain
-
 Sri Lanka
-
 Sweden
-
 Switzerland
-
 Syria
-
 Taiwan
-
 Tajikistan
-
 Tanzania
-
 Thailand
-
 Trinidad and Tobago
-
 Tunisia
-
 Turkey
-
 UAE
-
 Uganda
-
 Ukraine
-
 United Kingdom
-
United States
-
 Uruguay
-
 Uzbekistan
-
 Venezuela
-
 Vietnam
-
 Yemen
-
 Zambia
-
 Zimbabwe
- Forex
- Crypto












