

Hedera faces nearly 7% slide as trading activity rises after tokenized stocks launch: weekly analysis

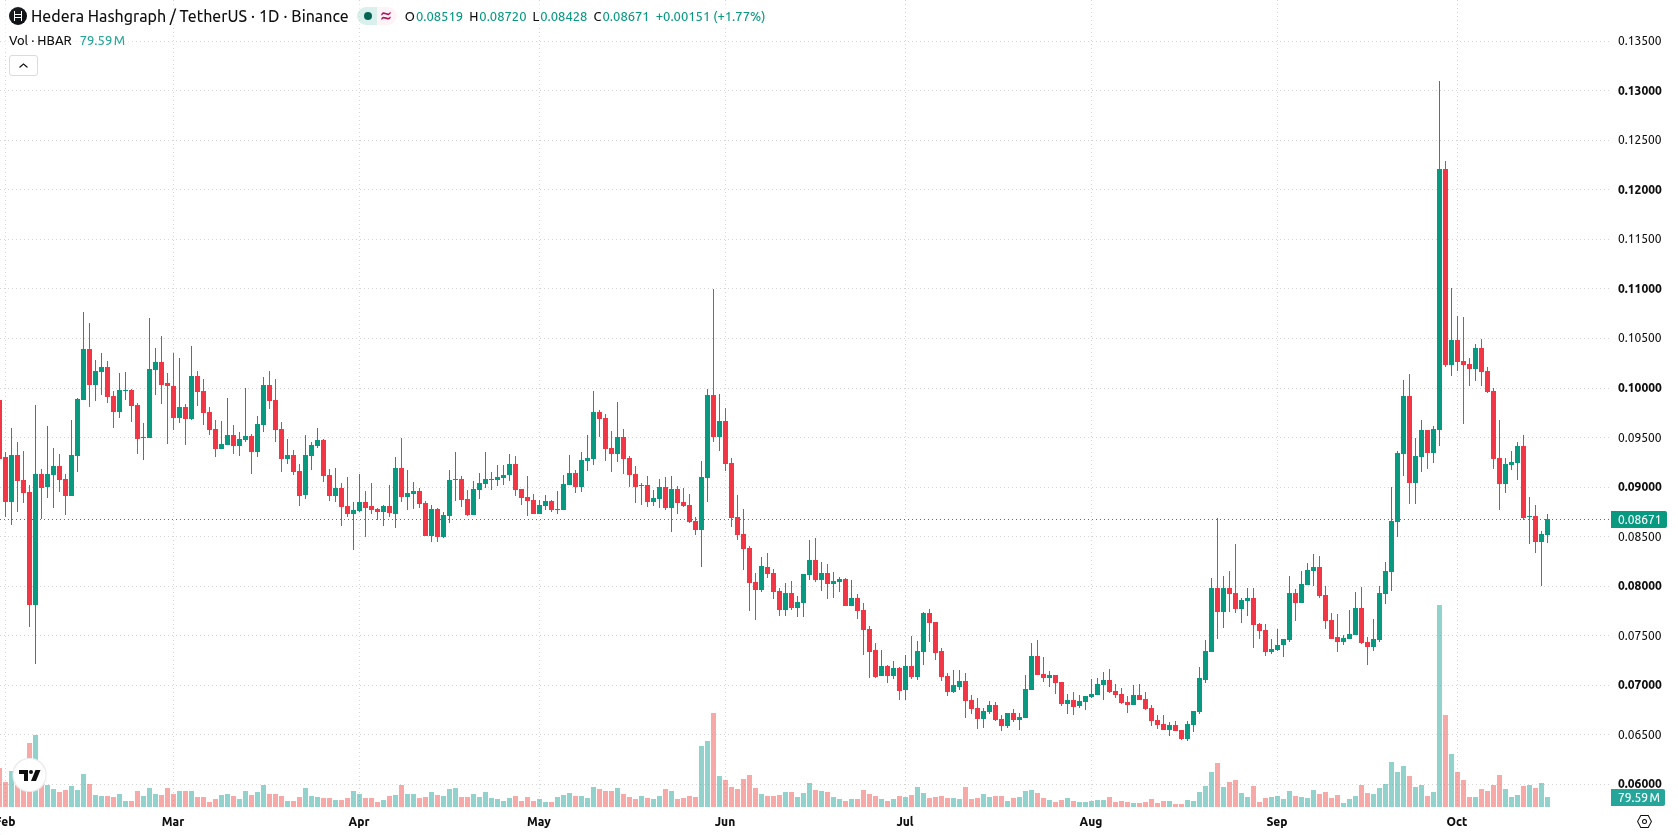
Hedera (HBAR) is hovering near $0.09 after retreating nearly 6% this week, with sellers dominating the chart following a steady decline. Bearish pressure and oversold signals have brought attention to support levels, making their defense critical for the week ahead as traders assess whether the downturn will stabilize or deepen.
 0.0855
0.0898
Highlights
- Hedera fell 6.29% over the past 7 days and is trading just above its long-term moving average support.
- The trend remains bearish in the short term, with indicators showing continued downside pressure and oversold conditions.
- Price is expected to oscillate between $0.0819 and $0.0868, with a 67% likelihood of further declines toward $0.0784.
Tokenization surge and partnership news lift transaction activity for the week
Hedera introduced tokenized versions of major stocks such as Apple, Nvidia, and Tesla, along with the SPDR S&P 500 ETF, on its blockchain during the week of October 8, 2026, according to TokenPost. These equities are now tradable via popular crypto wallets using HBAR or USDC, broadening access to real-world asset exposure within the network. This tokenization push was accompanied by a spike in daily transaction activity and signals Hedera's expanding footprint in blockchain-based asset markets.
Persistent downside momentum as technicals flag oversold yet unresolved risks
On the daily chart, bearish momentum prevails with a sustained move lower and a firm trend, shown by the ADX at 34.2369 and a negative Bull/Bear Power reading. The CCI and Stochastic RSI both indicate oversold conditions, even as volatility reached 19%. Immediate resistance sits at the MA-50 level of $0.0868, while the nearest support is the MA-200 at $0.0819. In this structure, further downside pressure remains possible unless buyers reclaim higher ground.
Downside favored in the coming week as range limits face breakout tests
Over the next 7 days, the expected range is $0.0784 to $0.0986, with a 33% probability of an increase and a 67% probability of a decrease. The base case anticipates the price oscillating between support at $0.0819 and resistance at $0.0868. A break above $0.0868 could open a move toward the Ichimoku Kijun at $0.1052. A sustained push below $0.0819 would likely expose the lower boundary of the projected range at $0.0784.
Earlier, analysts noted that Hedera was exhibiting persistent downside momentum and heightened intraday volatility as traders awaited a clear directional signal. The current analysis strengthens this view with fresh evidence of bearish dominance, highlighting the importance of $0.0819 as a pivotal support level that could define short-term risk for HBAR holders.









-
 Afghanistan
-
 Albania
-
 Algeria
-
 Angola
-
 Argentina
-
 Armenia
-
 Australia
-
 Austria
-
 Azerbaijan
-
 Bahamas
-
 Bahrain
-
 Bangladesh
-
 Belarus
-
 Belgium
-
 Bolivia
-
 Botswana
-
 Brazil
-
 Brunei
-
 Bulgaria
-
 Cambodia
-
 Cameroon
-
 Canada
-
 Chile
-
 China
-
 Colombia
-
 Congo
-
 Costa Rica
-
 Cote d'Ivoire
-
 Croatia
-
 Cuba
-
 Cyprus
-
 Czechia
-
 DR Congo
-
 Denmark
-
 Dominican Republic
-
 Ecuador
-
 Egypt
-
 El Salvador
-
 Estonia
-
 Eswatini
-
 Ethiopia
-
 Finland
-
 France
-
 Georgia
-
 Germany
-
 Ghana
-
 Greece
-
 Haiti
-
 Hong Kong
-
 Hungary
-
 India
-
 Indonesia
-
 Iran, Islamic republic
-
 Iraq
-
 Ireland
-
 Israel
-
 Italy
-
 Jamaica
-
 Japan
-
 Jordan
-
 Kazakhstan
-
 Kenya
-
 Korea
-
 Kuwait
-
 Kyrgyzstan
-
 Laos
-
 Latvia
-
 Lebanon
-
 Lesotho
-
 Libya
-
 Lithuania
-
 Luxembourg
-
 Madagascar
-
 Malaysia
-
 Malta
-
 Mauritius
-
 Mexico
-
 Moldova
-
 Mongolia
-
 Montenegro
-
 Morocco
-
 Mozambique
-
 Myanmar
-
 Namibia
-
 Nepal
-
 Netherlands
-
 New Zealand
-
 Nigeria
-
 North Macedonia
-
 Norway
-
 Oman
-
 Pakistan
-
 Palestine
-
 Panama
-
 Papua New Guinea
-
 Paraguay
-
 Peru
-
 Philippines
-
 Poland
-
 Portugal
-
 Puerto Rico
-
 Qatar
-
 Reunion
-
 Romania
-
 Rwanda
-
 Saudi Arabia
-
 Serbia
-
 Singapore
-
 Slovakia
-
 Slovenia
-
 Somalia
-
 South Africa
-
 Spain
-
 Sri Lanka
-
 Sweden
-
 Switzerland
-
 Syria
-
 Taiwan
-
 Tajikistan
-
 Tanzania
-
 Thailand
-
 Trinidad and Tobago
-
 Tunisia
-
 Turkey
-
 UAE
-
 Uganda
-
 Ukraine
-
 United Kingdom
-
United States
-
 Uruguay
-
 Uzbekistan
-
 Venezuela
-
 Vietnam
-
 Yemen
-
 Zambia
-
 Zimbabwe
- Forex
- Crypto












