

Hedera falls amid seller dominance and weak technical momentum

Hedera (HBAR) is trading at $0.0878, down 7.06% over the past day and showing notable intraday volatility. The price currently sits below its key moving averages, suggesting ongoing pressure relative to recent trends.
 0.0888
0.0999
0.0888
0.0999
Highlights
- Hedera released Agent Accounts on October 8, 2026, allowing AI bots to manage budgets and facilitate payments in HBAR or USDC with user-defined limits.
- HashPack wallet now permits tokenised stock trading on the Hedera network with HBAR or USDC, representing additional network functionality but little direct effect on HBAR price.
- HBAR trades below key moving averages and faces bearish momentum, with an expected price range of $0.0805 to $0.0908 and higher probability of further downside.
AI account rollout and stock token drive network utility, muted price impact
Hedera launched Agent Accounts on October 8, 2026, a development that enables AI bots to manage budgets and execute payments in either HBAR or USDC within user-specified limits, according to Techbullion. This functionality potentially broadens Hedera's utility for automated treasury management and real-world transaction processing, though its immediate effect on market demand has yet to materialize. Separately, Cryptoticker reported that HashPack, the largest wallet on the Hedera network, initiated support for tokenised stock trading via HBAR or USDC, although Hedera itself is not the issuer of these assets; this marks incremental network expansion but has limited direct influence on HBAR's price formation.
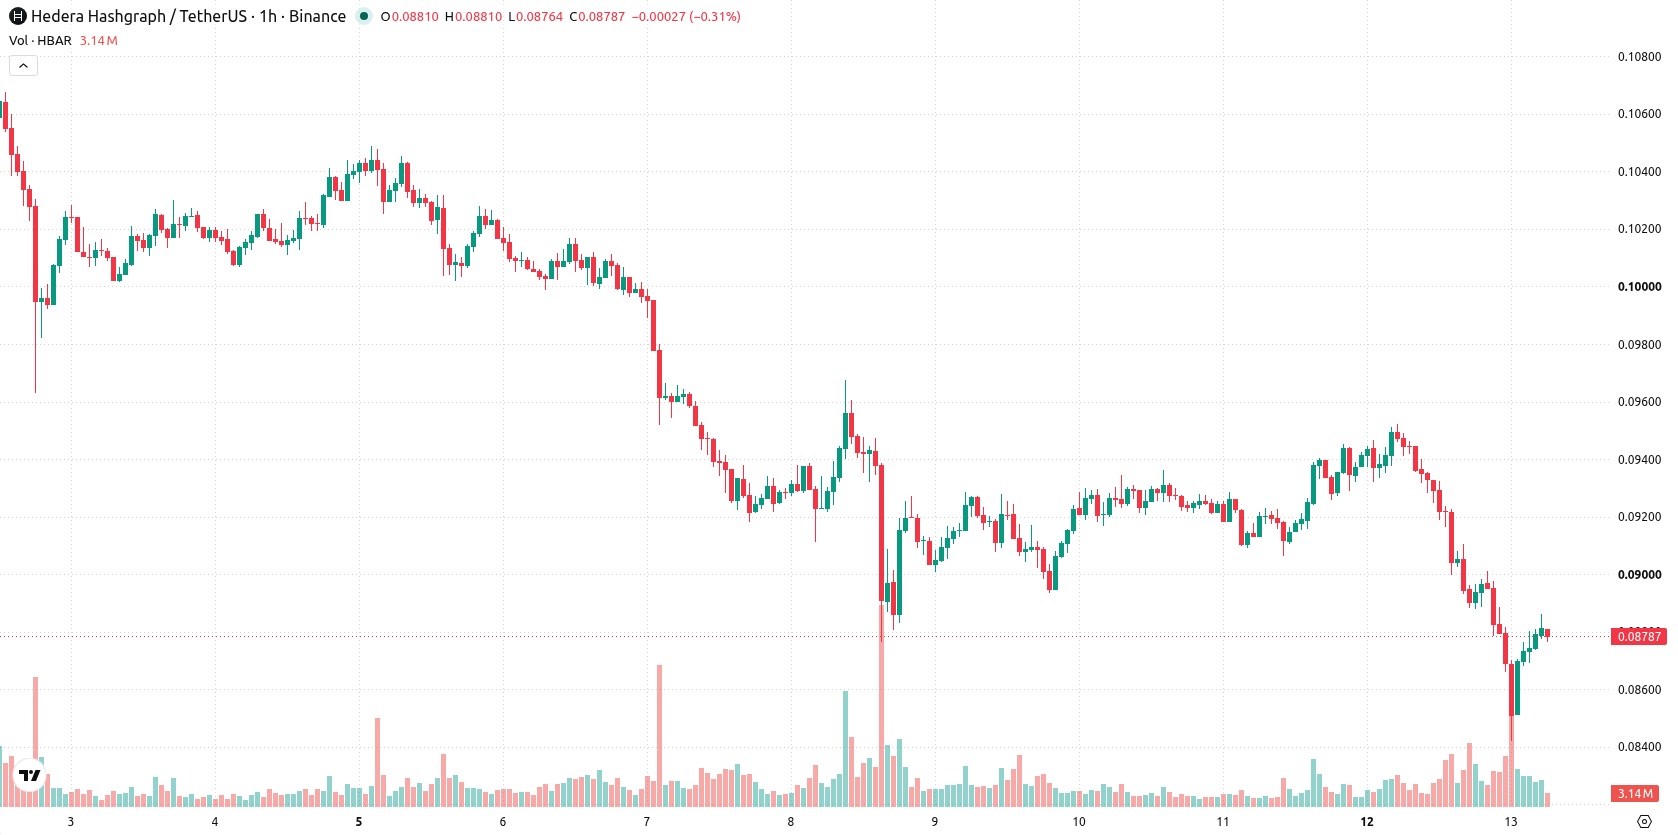
Bearish momentum prevails as price nears key technical resistance
HBAR/USD faces resistance at the Ichimoku Kijun level of $0.0897, with the price trading below both MA-20 ($0.0892) and MA-50 ($0.0916) on the hourly timeframe, but holding above the MA-200 ($0.0819). MACD produces a strong sell signal and ADX confirms bearish momentum, while the Stoch RSI points to overbought conditions that may signal short-term selling exhaustion. RSI maintains a sell bias, CCI is neutral, and Bull/Bear Power shows that sellers continue to dominate intraday momentum.
Downside favored as breakout risk remains subdued in consolidation
Over the short term, HBAR/USD is expected to consolidate within a volatility band of $0.0805 to $0.0908. The probability of an upside breakout is estimated at 30%, while the likelihood of further downside movement is higher at 70%. If the price breaks above $0.0897, a bullish move could gain traction, but a drop below $0.0805 would signal renewed selling pressure.
Earlier, analysts noted that HBAR's long-term structure remained constructive despite elevated short-term volatility and persistent selling pressure, with utility enhancements like tokenised stocks and programmable finance expanding network use cases. The current analysis adds to this view by highlighting continued downside momentum and intraday volatility, with traders advised to watch for a decisive move above $0.0897 or below $0.0805 as signals for the next directional phase.










-
 Afghanistan
-
 Albania
-
 Algeria
-
 Angola
-
 Argentina
-
 Armenia
-
 Australia
-
 Austria
-
 Azerbaijan
-
 Bahamas
-
 Bahrain
-
 Bangladesh
-
 Belarus
-
 Belgium
-
 Bolivia
-
 Botswana
-
 Brazil
-
 Brunei
-
 Bulgaria
-
 Cambodia
-
 Cameroon
-
 Canada
-
 Chile
Chile
-
 China
China
-
 Colombia
-
 Congo
Congo
-
 Costa Rica
-
 Cote d'Ivoire
-
 Croatia
-
 Cuba
Cuba
-
 Cyprus
-
 Czechia
-
 DR Congo
-
 Denmark
-
 Dominican Republic
-
 Ecuador
-
 Egypt
Egypt
-
 El Salvador
-
 Estonia
-
 Eswatini
-
 Ethiopia
-
 Finland
-
 France
-
 Georgia
-
 Germany
-
 Ghana
Ghana
-
 Greece
-
 Haiti
Haiti
-
 Hong Kong
-
 Hungary
-
 India
India
-
 Indonesia
-
 Iran, Islamic republic
-
 Iraq
Iraq
-
 Ireland
-
 Israel
-
 Italy
Italy
-
 Jamaica
-
 Japan
Japan
-
 Jordan
-
 Kazakhstan
-
 Kenya
Kenya
-
 Korea
Korea
-
 Kuwait
-
 Kyrgyzstan
-
 Laos
Laos
-
 Latvia
-
 Lebanon
-
 Lesotho
-
 Libya
Libya
-
 Lithuania
-
 Luxembourg
-
 Madagascar
-
 Malaysia
-
 Malta
Malta
-
 Mauritius
-
 Mexico
-
 Moldova
-
 Mongolia
-
 Montenegro
-
 Morocco
-
 Mozambique
-
 Myanmar
-
 Namibia
-
 Nepal
Nepal
-
 Netherlands
-
 New Zealand
-
 Nigeria
-
 North Macedonia
-
 Norway
-
 Oman
Oman
-
 Pakistan
-
 Palestine
-
 Panama
-
 Papua New Guinea
-
 Paraguay
-
 Peru
Peru
-
 Philippines
-
 Poland
-
 Portugal
-
 Puerto Rico
-
 Qatar
Qatar
-
 Reunion
-
 Romania
-
 Rwanda
-
 Saudi Arabia
-
 Serbia
-
 Singapore
-
 Slovakia
-
 Slovenia
-
 Somalia
-
 South Africa
-
 Spain
Spain
-
 Sri Lanka
-
 Sweden
-
 Switzerland
-
 Syria
Syria
-
 Taiwan
-
 Tajikistan
-
 Tanzania
-
 Thailand
-
 Trinidad and Tobago
-
 Tunisia
-
 Turkey
-
 UAE
UAE
-
 Uganda
-
 Ukraine
-
 United Kingdom
-
United States
-
 Uruguay
-
 Uzbekistan
-
 Venezuela
-
 Vietnam
-
 Yemen
Yemen
-
 Zambia
-
 Zimbabwe
- Forex
- Crypto












