

Sonic technical analysis: Bearish momentum persists near session lows

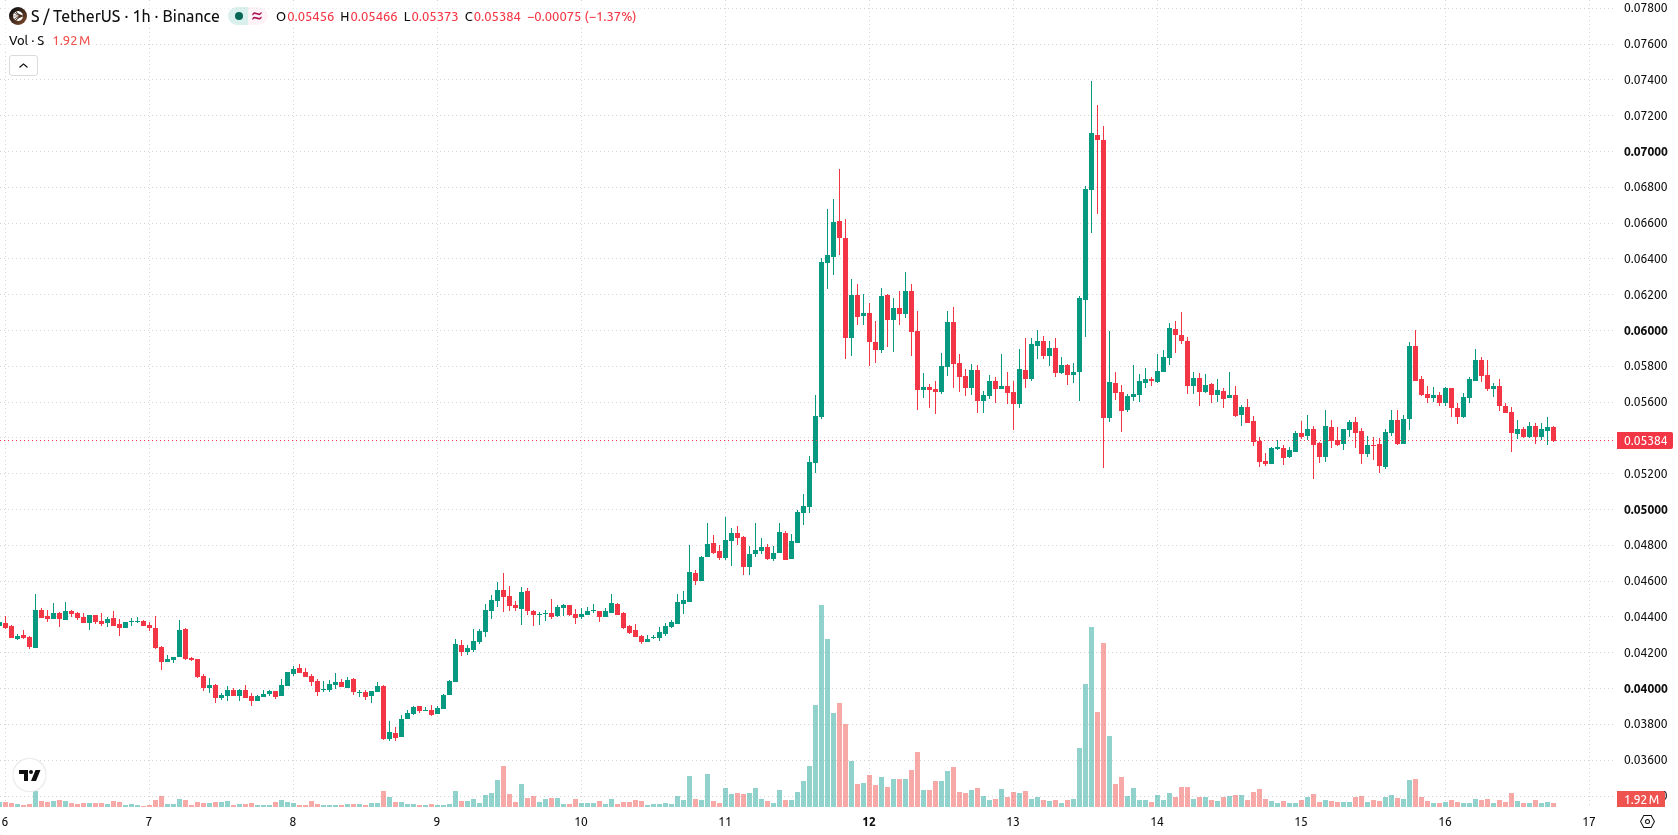
Sonic (S) is trading at $0.0538, marking a drop of 7.32% for the day. The asset currently sits below its key short- and medium-term moving averages, but remains above its longer-term daily average.
 0.0589
0.0739
0.0589
0.0739
Highlights
- Sonic trades below short-term averages, indicating persistent bearish momentum over recent trading sessions.
- Price fell 7.32% today to $0.0538 and currently hovers near the session low with high volatility.
- Technical signals suggest sellers dominate, and price is likely to move within a $0.0468 to $0.0608 range over the next 2 to 3 days.
Bearish momentum confirmed as price nears session low
On the technical side, S is trading below the MA-20 ($0.0557) and MA-50 ($0.0548) on the hourly chart, but remains above the MA-200 ($0.0345) on the daily chart. The immediate resistance is at the Ichimoku Kijun level of $0.0566. Momentum indicators are mostly bearish, with MACD showing a Sell bias, ADX reading as Neutral, and both RSI (44.84) and CCI signaling Sell. Stochastic RSI sits in oversold territory, indicating short-term exhaustion, while Bull/Bear Power points to intraday seller dominance and the Awesome Oscillator aligns with the current downtrend. The price is currently near the session low amid high volatility, and oscillators highlight ongoing selling pressure along with oversold technical signals.
Downside risk elevated as volatility shapes trading corridor
Over the next 2–3 trading days, the expected price range for S is $0.0468 to $0.0608, reflecting a typical volatility band relative to current levels. There is a 75% probability of a further downward move, while an upward rebound has a 25% likelihood. The base scenario anticipates stabilization within this corridor, with a bullish break scenario requiring a move above the Ichimoku Kijun resistance at $0.0566, and a bearish escalation signaled by a decline below $0.0468.
Earlier, analysts noted that Sonic showed short-term bullish momentum despite mixed technical signals and ongoing volatility. The current shift into a predominantly bearish setup suggests traders should now focus on the $0.0566 resistance as a key inflection point for any potential reversal.





Latest Sonic News





-
 Afghanistan
-
 Albania
-
 Algeria
-
 Angola
-
 Argentina
-
 Armenia
-
 Australia
-
 Austria
-
 Azerbaijan
-
 Bahamas
-
 Bahrain
-
 Bangladesh
-
 Belarus
-
 Belgium
-
 Bolivia
-
 Botswana
-
 Brazil
-
 Brunei
-
 Bulgaria
-
 Cambodia
-
 Cameroon
-
 Canada
-
 Chile
Chile
-
 China
China
-
 Colombia
-
 Congo
Congo
-
 Costa Rica
-
 Cote d'Ivoire
-
 Croatia
-
 Cuba
Cuba
-
 Cyprus
-
 Czechia
-
 DR Congo
-
 Denmark
-
 Dominican Republic
-
 Ecuador
-
 Egypt
Egypt
-
 El Salvador
-
 Estonia
-
 Eswatini
-
 Ethiopia
-
 Finland
-
 France
-
 Georgia
-
 Germany
-
 Ghana
Ghana
-
 Greece
-
 Haiti
Haiti
-
 Hong Kong
-
 Hungary
-
 India
India
-
 Indonesia
-
 Iran, Islamic republic
-
 Iraq
Iraq
-
 Ireland
-
 Israel
-
 Italy
Italy
-
 Jamaica
-
 Japan
Japan
-
 Jordan
-
 Kazakhstan
-
 Kenya
Kenya
-
 Korea
Korea
-
 Kuwait
-
 Kyrgyzstan
-
 Laos
Laos
-
 Latvia
-
 Lebanon
-
 Lesotho
-
 Libya
Libya
-
 Lithuania
-
 Luxembourg
-
 Madagascar
-
 Malaysia
-
 Malta
Malta
-
 Mauritius
-
 Mexico
-
 Moldova
-
 Mongolia
-
 Montenegro
-
 Morocco
-
 Mozambique
-
 Myanmar
-
 Namibia
-
 Nepal
Nepal
-
 Netherlands
-
 New Zealand
-
 Nigeria
-
 North Macedonia
-
 Norway
-
 Oman
Oman
-
 Pakistan
-
 Palestine
-
 Panama
-
 Papua New Guinea
-
 Paraguay
-
 Peru
Peru
-
 Philippines
-
 Poland
-
 Portugal
-
 Puerto Rico
-
 Qatar
Qatar
-
 Reunion
-
 Romania
-
 Rwanda
-
 Saudi Arabia
-
 Serbia
-
 Singapore
-
 Slovakia
-
 Slovenia
-
 Somalia
-
 South Africa
-
 Spain
Spain
-
 Sri Lanka
-
 Sweden
-
 Switzerland
-
 Syria
Syria
-
 Taiwan
-
 Tajikistan
-
 Tanzania
-
 Thailand
-
 Trinidad and Tobago
-
 Tunisia
-
 Turkey
-
 UAE
UAE
-
 Uganda
-
 Ukraine
-
 United Kingdom
-
United States
-
 Uruguay
-
 Uzbekistan
-
 Venezuela
-
 Vietnam
-
 Yemen
Yemen
-
 Zambia
-
 Zimbabwe
- Forex
- Crypto












