

GALA slides as downward price move dominates trading

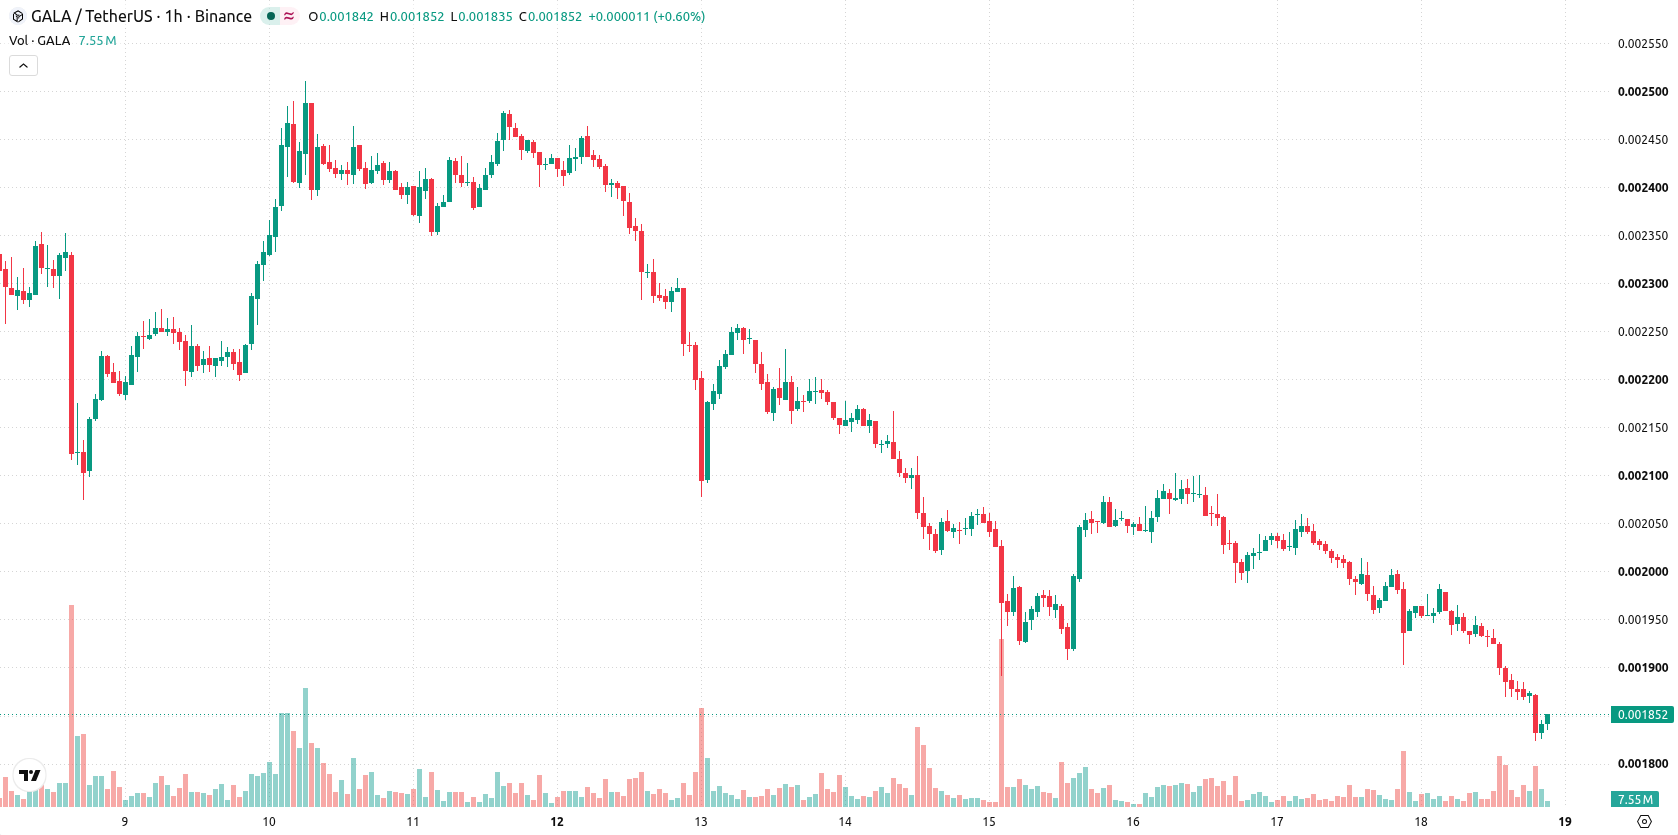
Gala (GALA) is trading at $0.00185, marking a daily decline of 6.52%. The price sits below its key moving averages, showing continued pressure across multiple timeframes.
 0.001932
0.00225800
Highlights
- GALA/USD trades below key moving averages on hourly and daily charts, indicating sustained seller pressure across timeframes.
- Momentum indicators remain bearish, with MACD, ADX, RSI, Stoch RSI, and CCI all supporting a strong downtrend.
- Expected price action for the next 2 to 3 days is range-bound between $0.001681 and $0.00197813, with a high probability of further decline.
Bearish momentum confirmed as oversold signals and resistances align
On the hourly chart, GALA/USD remains below the MA-20 of $0.00191555 and MA-50 of $0.0019688, while also staying well under the daily MA-200 at $0.00246437. The Ichimoku Kijun stands at $0.001913, acting as immediate resistance. Momentum indicators are strongly bearish: both MACD and ADX confirm persistent downside, while RSI, Stoch RSI, and CCI are in oversold territory, reflecting stretched price action without a reversal signal. Bull/Bear Power demonstrates clear seller dominance intraday, and Awesome Oscillator further aligns with the current downtrend.
Downside bias retained as volatility limits recovery potential
Over the next 2–3 trading days, GALA/USD is likely to move within a band of $0.001681 to $0.00197813, reflecting typical volatility at current levels. The outlook heavily favors further downside, with a low probability for a sustained bounce. A move above $0.001913 would be required to trigger a bullish scenario, while a drop below $0.001681 could prompt additional losses. The most probable scenario is sideways to slightly lower trading within the stated range.
Earlier, analysts noted that Gala remained under sustained bearish pressure with technical indicators signaling limited upside potential. The current analysis reinforces this view, as renewed downside momentum establishes $0.001913 as a critical resistance level to monitor for any potential shift in trend.










-
 Afghanistan
-
 Albania
-
 Algeria
-
 Angola
-
 Argentina
-
 Armenia
-
 Australia
-
 Austria
-
 Azerbaijan
-
 Bahamas
-
 Bahrain
-
 Bangladesh
-
 Belarus
-
 Belgium
-
 Bolivia
-
 Botswana
-
 Brazil
-
 Brunei
-
 Bulgaria
-
 Cambodia
-
 Cameroon
-
 Canada
-
 Chile
-
 China
-
 Colombia
-
 Congo
-
 Costa Rica
-
 Cote d'Ivoire
-
 Croatia
-
 Cuba
-
 Cyprus
-
 Czechia
-
 DR Congo
-
 Denmark
-
 Dominican Republic
-
 Ecuador
-
 Egypt
-
 El Salvador
-
 Estonia
-
 Eswatini
-
 Ethiopia
-
 Finland
-
 France
-
 Georgia
-
 Germany
-
 Ghana
-
 Greece
-
 Haiti
-
 Hong Kong
-
 Hungary
-
 India
-
 Indonesia
-
 Iran, Islamic republic
-
 Iraq
-
 Ireland
-
 Israel
-
 Italy
-
 Jamaica
-
 Japan
-
 Jordan
-
 Kazakhstan
-
 Kenya
-
 Korea
-
 Kuwait
-
 Kyrgyzstan
-
 Laos
-
 Latvia
-
 Lebanon
-
 Lesotho
-
 Libya
-
 Lithuania
-
 Luxembourg
-
 Madagascar
-
 Malaysia
-
 Malta
-
 Mauritius
-
 Mexico
-
 Moldova
-
 Mongolia
-
 Montenegro
-
 Morocco
-
 Mozambique
-
 Myanmar
-
 Namibia
-
 Nepal
-
 Netherlands
-
 New Zealand
-
 Nigeria
-
 North Macedonia
-
 Norway
-
 Oman
-
 Pakistan
-
 Palestine
-
 Panama
-
 Papua New Guinea
-
 Paraguay
-
 Peru
-
 Philippines
-
 Poland
-
 Portugal
-
 Puerto Rico
-
 Qatar
-
 Reunion
-
 Romania
-
 Rwanda
-
 Saudi Arabia
-
 Serbia
-
 Singapore
-
 Slovakia
-
 Slovenia
-
 Somalia
-
 South Africa
-
 Spain
-
 Sri Lanka
-
 Sweden
-
 Switzerland
-
 Syria
-
 Taiwan
-
 Tajikistan
-
 Tanzania
-
 Thailand
-
 Trinidad and Tobago
-
 Tunisia
-
 Turkey
-
 UAE
-
 Uganda
-
 Ukraine
-
 United Kingdom
-
United States
-
 Uruguay
-
 Uzbekistan
-
 Venezuela
-
 Vietnam
-
 Yemen
-
 Zambia
-
 Zimbabwe
- Forex
- Crypto












